GKD-C Super 6x [Loxx]Giga Kaleidoscope GKD-C Super 6x: RSI, MACD, Stochastic, Loxxer, CCI, & Velocity is a Confirmation module included in Loxx's "Giga Kaleidoscope Modularized Trading System".
█ Giga Kaleidoscope Modularized Trading System
What is Loxx's "Giga Kaleidoscope Modularized Trading System"?
The Giga Kaleidoscope Modularized Trading System is a trading system built on the philosophy of the NNFX (No Nonsense Forex) algorithmic trading.
What is the NNFX algorithmic trading strategy?
The NNFX (No-Nonsense Forex) trading system is a comprehensive approach to Forex trading that is designed to simplify the process and remove the confusion and complexity that often surrounds trading. The system was developed by a Forex trader who goes by the pseudonym "VP" and has gained a significant following in the Forex community.
The NNFX trading system is based on a set of rules and guidelines that help traders make objective and informed decisions. These rules cover all aspects of trading, including market analysis, trade entry, stop loss placement, and trade management.
Here are the main components of the NNFX trading system:
1. Trading Philosophy: The NNFX trading system is based on the idea that successful trading requires a comprehensive understanding of the market, objective analysis, and strict risk management. The system aims to remove subjective elements from trading and focuses on objective rules and guidelines.
2. Technical Analysis: The NNFX trading system relies heavily on technical analysis and uses a range of indicators to identify high-probability trading opportunities. The system uses a combination of trend-following and mean-reverting strategies to identify trades.
3. Market Structure: The NNFX trading system emphasizes the importance of understanding the market structure, including price action, support and resistance levels, and market cycles. The system uses a range of tools to identify the market structure, including trend lines, channels, and moving averages.
4. Trade Entry: The NNFX trading system has strict rules for trade entry. The system uses a combination of technical indicators to identify high-probability trades, and traders must meet specific criteria to enter a trade.
5. Stop Loss Placement: The NNFX trading system places a significant emphasis on risk management and requires traders to place a stop loss order on every trade. The system uses a combination of technical analysis and market structure to determine the appropriate stop loss level.
6. Trade Management: The NNFX trading system has specific rules for managing open trades. The system aims to minimize risk and maximize profit by using a combination of trailing stops, take profit levels, and position sizing.
Overall, the NNFX trading system is designed to be a straightforward and easy-to-follow approach to Forex trading that can be applied by traders of all skill levels.
Core components of an NNFX algorithmic trading strategy
The NNFX algorithm is built on the principles of trend, momentum, and volatility. There are six core components in the NNFX trading algorithm:
1. Volatility - price volatility; e.g., Average True Range, True Range Double, Close-to-Close, etc.
2. Baseline - a moving average to identify price trend
3. Confirmation 1 - a technical indicator used to identify trends
4. Confirmation 2 - a technical indicator used to identify trends
5. Continuation - a technical indicator used to identify trends
6. Volatility/Volume - a technical indicator used to identify volatility/volume breakouts/breakdown
7. Exit - a technical indicator used to determine when a trend is exhausted
What is Volatility in the NNFX trading system?
In the NNFX (No Nonsense Forex) trading system, ATR (Average True Range) is typically used to measure the volatility of an asset. It is used as a part of the system to help determine the appropriate stop loss and take profit levels for a trade. ATR is calculated by taking the average of the true range values over a specified period.
True range is calculated as the maximum of the following values:
-Current high minus the current low
-Absolute value of the current high minus the previous close
-Absolute value of the current low minus the previous close
ATR is a dynamic indicator that changes with changes in volatility. As volatility increases, the value of ATR increases, and as volatility decreases, the value of ATR decreases. By using ATR in NNFX system, traders can adjust their stop loss and take profit levels according to the volatility of the asset being traded. This helps to ensure that the trade is given enough room to move, while also minimizing potential losses.
Other types of volatility include True Range Double (TRD), Close-to-Close, and Garman-Klass
What is a Baseline indicator?
The baseline is essentially a moving average, and is used to determine the overall direction of the market.
The baseline in the NNFX system is used to filter out trades that are not in line with the long-term trend of the market. The baseline is plotted on the chart along with other indicators, such as the Moving Average (MA), the Relative Strength Index (RSI), and the Average True Range (ATR).
Trades are only taken when the price is in the same direction as the baseline. For example, if the baseline is sloping upwards, only long trades are taken, and if the baseline is sloping downwards, only short trades are taken. This approach helps to ensure that trades are in line with the overall trend of the market, and reduces the risk of entering trades that are likely to fail.
By using a baseline in the NNFX system, traders can have a clear reference point for determining the overall trend of the market, and can make more informed trading decisions. The baseline helps to filter out noise and false signals, and ensures that trades are taken in the direction of the long-term trend.
What is a Confirmation indicator?
Confirmation indicators are technical indicators that are used to confirm the signals generated by primary indicators. Primary indicators are the core indicators used in the NNFX system, such as the Average True Range (ATR), the Moving Average (MA), and the Relative Strength Index (RSI).
The purpose of the confirmation indicators is to reduce false signals and improve the accuracy of the trading system. They are designed to confirm the signals generated by the primary indicators by providing additional information about the strength and direction of the trend.
Some examples of confirmation indicators that may be used in the NNFX system include the Bollinger Bands, the MACD (Moving Average Convergence Divergence), and the MACD Oscillator. These indicators can provide information about the volatility, momentum, and trend strength of the market, and can be used to confirm the signals generated by the primary indicators.
In the NNFX system, confirmation indicators are used in combination with primary indicators and other filters to create a trading system that is robust and reliable. By using multiple indicators to confirm trading signals, the system aims to reduce the risk of false signals and improve the overall profitability of the trades.
What is a Continuation indicator?
In the NNFX (No Nonsense Forex) trading system, a continuation indicator is a technical indicator that is used to confirm a current trend and predict that the trend is likely to continue in the same direction. A continuation indicator is typically used in conjunction with other indicators in the system, such as a baseline indicator, to provide a comprehensive trading strategy.
What is a Volatility/Volume indicator?
Volume indicators, such as the On Balance Volume (OBV), the Chaikin Money Flow (CMF), or the Volume Price Trend (VPT), are used to measure the amount of buying and selling activity in a market. They are based on the trading volume of the market, and can provide information about the strength of the trend. In the NNFX system, volume indicators are used to confirm trading signals generated by the Moving Average and the Relative Strength Index. Volatility indicators include Average Direction Index, Waddah Attar, and Volatility Ratio. In the NNFX trading system, volatility is a proxy for volume and vice versa.
By using volume indicators as confirmation tools, the NNFX trading system aims to reduce the risk of false signals and improve the overall profitability of trades. These indicators can provide additional information about the market that is not captured by the primary indicators, and can help traders to make more informed trading decisions. In addition, volume indicators can be used to identify potential changes in market trends and to confirm the strength of price movements.
What is an Exit indicator?
The exit indicator is used in conjunction with other indicators in the system, such as the Moving Average (MA), the Relative Strength Index (RSI), and the Average True Range (ATR), to provide a comprehensive trading strategy.
The exit indicator in the NNFX system can be any technical indicator that is deemed effective at identifying optimal exit points. Examples of exit indicators that are commonly used include the Parabolic SAR, the Average Directional Index (ADX), and the Chandelier Exit.
The purpose of the exit indicator is to identify when a trend is likely to reverse or when the market conditions have changed, signaling the need to exit a trade. By using an exit indicator, traders can manage their risk and prevent significant losses.
In the NNFX system, the exit indicator is used in conjunction with a stop loss and a take profit order to maximize profits and minimize losses. The stop loss order is used to limit the amount of loss that can be incurred if the trade goes against the trader, while the take profit order is used to lock in profits when the trade is moving in the trader's favor.
Overall, the use of an exit indicator in the NNFX trading system is an important component of a comprehensive trading strategy. It allows traders to manage their risk effectively and improve the profitability of their trades by exiting at the right time.
How does Loxx's GKD (Giga Kaleidoscope Modularized Trading System) implement the NNFX algorithm outlined above?
Loxx's GKD v1.0 system has five types of modules (indicators/strategies). These modules are:
1. GKD-BT - Backtesting module (Volatility, Number 1 in the NNFX algorithm)
2. GKD-B - Baseline module (Baseline and Volatility/Volume, Numbers 1 and 2 in the NNFX algorithm)
3. GKD-C - Confirmation 1/2 and Continuation module (Confirmation 1/2 and Continuation, Numbers 3, 4, and 5 in the NNFX algorithm)
4. GKD-V - Volatility/Volume module (Confirmation 1/2, Number 6 in the NNFX algorithm)
5. GKD-E - Exit module (Exit, Number 7 in the NNFX algorithm)
(additional module types will added in future releases)
Each module interacts with every module by passing data between modules. Data is passed between each module as described below:
GKD-B => GKD-V => GKD-C(1) => GKD-C(2) => GKD-C(Continuation) => GKD-E => GKD-BT
That is, the Baseline indicator passes its data to Volatility/Volume. The Volatility/Volume indicator passes its values to the Confirmation 1 indicator. The Confirmation 1 indicator passes its values to the Confirmation 2 indicator. The Confirmation 2 indicator passes its values to the Continuation indicator. The Continuation indicator passes its values to the Exit indicator, and finally, the Exit indicator passes its values to the Backtest strategy.
This chaining of indicators requires that each module conform to Loxx's GKD protocol, therefore allowing for the testing of every possible combination of technical indicators that make up the six components of the NNFX algorithm.
What does the application of the GKD trading system look like?
Example trading system:
Backtest: Strategy with 1-3 take profits, trailing stop loss, multiple types of PnL volatility, and 2 backtesting styles
Baseline: Hull Moving Average
Volatility/Volume: Hurst Exponent
Confirmation 1: Super 6x: RSI, MACD, Stochastic, Loxxer, CCI, & Velocity as shown on the chart above
Confirmation 2: Williams Percent Range
Continuation: Fisher Transform
Exit: Rex Oscillator
Each GKD indicator is denoted with a module identifier of either: GKD-BT, GKD-B, GKD-C, GKD-V, or GKD-E. This allows traders to understand to which module each indicator belongs and where each indicator fits into the GKD protocol chain.
Giga Kaleidoscope Modularized Trading System Signals (based on the NNFX algorithm)
Standard Entry
1. GKD-C Confirmation 1 Signal
2. GKD-B Baseline agrees
3. Price is within a range of 0.2x Volatility and 1.0x Volatility of the Goldie Locks Mean
4. GKD-C Confirmation 2 agrees
5. GKD-V Volatility/Volume agrees
Baseline Entry
1. GKD-B Baseline signal
2. GKD-C Confirmation 1 agrees
3. Price is within a range of 0.2x Volatility and 1.0x Volatility of the Goldie Locks Mean
4. GKD-C Confirmation 2 agrees
5. GKD-V Volatility/Volume agrees
6. GKD-C Confirmation 1 signal was less than 7 candles prior
Continuation Entry
1. Standard Entry, Baseline Entry, or Pullback; entry triggered previously
2. GKD-B Baseline hasn't crossed since entry signal trigger
3. GKD-C Confirmation Continuation Indicator signals
4. GKD-C Confirmation 1 agrees
5. GKD-B Baseline agrees
6. GKD-C Confirmation 2 agrees
1-Candle Rule Standard Entry
1. GKD-C Confirmation 1 signal
2. GKD-B Baseline agrees
3. Price is within a range of 0.2x Volatility and 1.0x Volatility of the Goldie Locks Mean
Next Candle:
1. Price retraced (Long: close < close or Short: close > close )
2. GKD-B Baseline agrees
3. GKD-C Confirmation 1 agrees
4. GKD-C Confirmation 2 agrees
5. GKD-V Volatility/Volume agrees
1-Candle Rule Baseline Entry
1. GKD-B Baseline signal
2. GKD-C Confirmation 1 agrees
3. Price is within a range of 0.2x Volatility and 1.0x Volatility of the Goldie Locks Mean
4. GKD-C Confirmation 1 signal was less than 7 candles prior
Next Candle:
1. Price retraced (Long: close < close or Short: close > close )
2. GKD-B Baseline agrees
3. GKD-C Confirmation 1 agrees
4. GKD-C Confirmation 2 agrees
5. GKD-V Volatility/Volume Agrees
PullBack Entry
1. GKD-B Baseline signal
2. GKD-C Confirmation 1 agrees
3. Price is beyond 1.0x Volatility of Baseline
Next Candle:
1. Price is within a range of 0.2x Volatility and 1.0x Volatility of the Goldie Locks Mean
3. GKD-C Confirmation 1 agrees
4. GKD-C Confirmation 2 agrees
5. GKD-V Volatility/Volume Agrees
█ GKD-C Super 6x: RSI, MACD, Stochastic, Loxxer, CCI, & Velocity
What is MACD?
MACD stands for Moving Average Convergence Divergence. It is a technical indicator used in financial analysis to track the trend and momentum of a security or market index. The MACD indicator consists of two lines, a faster-moving average called the MACD line, and a slower-moving average called the signal line.
The MACD line is calculated by subtracting the 26-period exponential moving average (EMA) from the 12-period EMA. The signal line is a 9-period EMA of the MACD line. The MACD line oscillates above and below the zero line, which represents the equilibrium point between the bullish and bearish forces.
Traders use the MACD indicator to identify changes in trend and momentum. When the MACD line crosses above the signal line, it is considered a bullish signal, indicating that the momentum is shifting towards the upside. Conversely, when the MACD line crosses below the signal line, it is considered a bearish signal, indicating that the momentum is shifting towards the downside.
The MACD indicator can also be used to identify divergences between the MACD line and the price action. A bullish divergence occurs when the price is making lower lows, but the MACD line is making higher lows. This could indicate that the downward momentum is weakening, and a potential trend reversal could be imminent. A bearish divergence occurs when the price is making higher highs, but the MACD line is making lower highs, indicating that the upward momentum is weakening, and a potential trend reversal could be imminent.
Overall, the MACD indicator is a versatile tool that can be used in conjunction with other technical indicators and chart patterns to make informed trading decisions.
What is CCI?
The Commodity Channel Index ( CCI ) is a technical analysis indicator that was developed by Donald Lambert in 1980. It's primarily used to identify overbought and oversold conditions in the market, as well as trend direction and potential price reversals.
The CCI is calculated by taking the difference between the typical price (the average of the high, low, and close prices) and a moving average of the typical price over a certain period of time. This difference is then divided by a factor based on the average deviation of the typical price from the moving average.
The formula for the CCI is:
CCI = (Typical Price - 20-period SMA of Typical Price) / (0.015 x Mean Deviation)
Where:
Typical Price = (High + Low + Close) / 3
SMA = Simple Moving Average
Mean Deviation = Average of the absolute value of the difference between the Typical Price and the SMA over the last 20 periods.
The CCI is usually displayed as a line chart that oscillates around a centerline of zero. Readings above zero indicate that the typical price is above the moving average, while readings below zero indicate that the typical price is below the moving average.
Traders typically use the CCI to identify overbought and oversold conditions in the market. When the CCI rises above a certain level (e.g., +100), it's considered overbought, indicating that the price may be due for a correction or reversal. When the CCI falls below a certain level (e.g., -100), it's considered oversold, indicating that the price may be due for a bounce or reversal.
The CCI can also be used to identify potential trend reversals. When the CCI crosses above or below the zero line, it can signal a potential change in trend. For example, if the CCI crosses above the zero line, it could indicate that a bullish trend is emerging, while a cross below the zero line could indicate that a bearish trend is emerging.
Overall, the Commodity Channel Index is a useful technical analysis tool for identifying overbought and oversold conditions, as well as potential trend reversals in the market. However, like all technical indicators, it should be used in conjunction with other forms of analysis and risk management techniques to make informed trading decisions.
What is RSI?
The RSI, or Relative Strength Index, is a popular technical analysis tool used to measure the strength of a security's price action and identify potential trend reversals. It was developed by J. Welles Wilder and is based on the concept that price action tends to follow a momentum pattern.
The RSI is calculated based on the average gain and loss of a security's price over a specified period, usually 14 periods. It oscillates between 0 and 100 and is represented as a single line on a chart.
The RSI is calculated as follows:
RS = Average Gain / Average Loss
RSI = 100 - (100 / (1 + RS))
Where the Average Gain is the sum of all gains divided by the number of periods, and the Average Loss is the sum of all losses divided by the number of periods.
The RSI is used to identify overbought and oversold conditions in a security or market index. When the RSI rises above 70, it is considered overbought, indicating that the security may be overvalued and due for a price correction. Conversely, when the RSI falls below 30, it is considered oversold, indicating that the security may be undervalued and due for a price rebound.
Traders can also use the RSI to identify potential trend reversals. When the RSI forms a divergent pattern with the price action, it could indicate that the security is losing momentum and may be reversing to the upside or downside.
Overall, the RSI is a useful tool for traders to identify potential buy and sell signals, as well as to confirm trends and reversals. However, it should not be used in isolation, and traders should consider using other technical indicators and fundamental analysis to make informed trading decisions.
What is Stochastic?
The stochastic oscillator is a momentum indicator used in technical analysis to measure the current closing price of a security or market index relative to its price range over a specified period. The indicator consists of two lines, the %K line and the %D line, which oscillate between 0 and 100.
The %K line is calculated as follows:
%K = 100 x (Closing Price - Lowest Low) / (Highest High - Lowest Low)
Where:
Closing Price is the most recent closing price of the security.
Lowest Low is the lowest low of the security over a specified period (usually 14 periods).
Highest High is the highest high of the security over the same specified period.
The %D line is a 3-period simple moving average of the %K line. The %D line is slower than the %K line and is used to smooth out the volatility of the %K line.
The stochastic oscillator is used to identify overbought and oversold conditions in a security or market index. When the %K line rises above 80, it is considered overbought, indicating that the security may be overvalued and due for a price correction. Conversely, when the %K line falls below 20, it is considered oversold, indicating that the security may be undervalued and due for a price rebound.
Traders can also use the stochastic oscillator to identify bullish and bearish divergences between the %K line and the price action. A bullish divergence occurs when the %K line is making higher lows while the price action is making lower lows, indicating that the momentum is shifting towards the upside. A bearish divergence occurs when the %K line is making lower highs while the price action is making higher highs, indicating that the momentum is shifting towards the downside.
Overall, the stochastic oscillator is a useful tool for traders to identify potential buy and sell signals, as well as to confirm trends and reversals. However, it should not be used in isolation, and traders should consider using other technical indicators and fundamental analysis to make informed trading decisions.
What is Loxxer?
The Loxxer Index is a technical indicator used in financial analysis to identify potential trend reversals and overbought/oversold conditions in a security or market index. It was developed by Loxx and is also known as the Loxx Indicator.
The Loxxer Index is calculated based on the high, low, and closing prices of a security over a specified period. It measures the demand for the security by comparing the current high and low prices with the previous high and low prices. The indicator oscillates between 0 and 1 and is represented as a single line on a chart.
The Loxxer Index is calculated as follows:
LoxxMax = Current High - Previous High
LoxxMin = Previous Low - Current Low
If LoxxMax is greater than LoxxMin, then the Loxxer Index is calculated as follows:
Loxxer = LoxxMax / (LoxxMax + Current Close - Previous Close)
If LoxxMax is less than or equal to LoxxMin, then the Loxxer Index is calculated as follows:
Loxxer = 0
The Loxxer Index is used to identify overbought and oversold conditions in a security or market index. When the Loxxer Index rises above 0.7, it is considered overbought, indicating that the security may be overvalued and due for a price correction. Conversely, when the Loxxer Index falls below 0.3, it is considered oversold, indicating that the security may be undervalued and due for a price rebound.
Traders can also use the Loxxer Index to identify potential trend reversals. When the Loxxer Index forms a higher low while the price action forms a lower low, it could indicate that the security is losing momentum and may be reversing to the upside. Conversely, when the Loxxer Index forms a lower high while the price action forms a higher high, it could indicate that the security is losing momentum and may be reversing to the downside.
Overall, the Loxxer Index is a useful tool for traders to identify potential buy and sell signals, as well as to confirm trends and reversals. However, it should not be used in isolation, and traders should consider using other technical indicators and fundamental analysis to make informed trading decisions.
What is Velocity?
The Velocity Indicator is a technical analysis tool used to measure the speed and momentum of price movements in a security or market index. It is a type of oscillator that is used to identify potential trend reversals and overbought/oversold conditions.
The Velocity Indicator is calculated based on the difference between the current price and the price from a specified number of periods ago. It measures the rate of change of the price movement over time and is represented as a single line on a chart.
The Velocity Indicator is calculated as follows:
Velocity = (Current Price - Price from N periods ago) / Price from N periods ago x 100
Where N is the number of periods used in the calculation.
The Velocity Indicator is used to identify overbought and oversold conditions in a security or market index. When the Velocity Indicator rises above 1, it is considered overbought, indicating that the security may be overvalued and due for a price correction. Conversely, when the Velocity Indicator falls below -1, it is considered oversold, indicating that the security may be undervalued and due for a price rebound.
Traders can also use the Velocity Indicator to identify potential trend reversals. When the Velocity Indicator crosses above its moving average, it could indicate that the security is gaining momentum and may be reversing to the upside. Conversely, when the Velocity Indicator crosses below its moving average, it could indicate that the security is losing momentum and may be reversing to the downside.
Overall, the Velocity Indicator is a useful tool for traders to identify potential buy and sell signals, as well as to confirm trends and reversals. However, it should not be used in isolation, and traders should consider using other technical indicators and fundamental analysis to make informed trading decisions.
What is Super 6x: RSI, MACD, Stochastic, Loxxer, CCI, & Velocity?
Super 6x combines all 6 indicators into one signal, long or short
Requirements
Inputs
Confirmation 1 and Solo Confirmation: GKD-V Volatility / Volume indicator
Confirmation 2: GKD-C Confirmation indicator
Outputs
Confirmation 2 and Solo Confirmation Complex: GKD-E Exit indicator
Confirmation 1: GKD-C Confirmation indicator
Continuation: GKD-E Exit indicator
Solo Confirmation Simple: GKD-BT Backtest strategy
Additional features will be added in future releases.
Komut dosyalarını "RSI MACD" için ara

RSI PRECISION (MACD & SMA Signals)RSI PRECISION (Plus MACD & SMA Signals)
Codded by Giorgos Protonotarios, March 2022
This is an enhanced version of RSI PRECISION that incorporates RSI readings and key TA signals into a single oscillator.
■ RSI PRECISION SHORT DESCRIPTION & WHAT IS NEW
RSI PRECISION is an oscillator designed to enhance the classic RSI with price volatility and make it more accurate at longer time frames and during choppy market conditions. The oscillator is ideal for analyzing volatile markets, such as the cryptocurrency market.
In this second version, the RSI Precision formula remains the same, however, there are additional features.
The new oscillator now includes three different trading signals:
• MACD Crossovers (•) -New
• SMA Death/Golden Crosses (x) -New
• RSI Crossovers/Crossunders (▲▼)
■ MACD BULLISH & BEARISH CROSSOVERS
The MACD signals are visualized by a green/red dot (•). The default settings are the standard MACD settings (12,6,9).
NOTE: In lower timeframes, MACD generates too many signals. You can switch off “MACD BULLISH & BEARISH CROSSOVERS” by clicking on ‘SETTINGS’, then ‘STYLE’, and then unselecting ‘Bullish MACD Cross’ and ‘Bearish MACD Cross’.
(i) Bullish MACD cross
• Symbol: Green Dot (•) on the Top
• Event: MACD crosses above its signal line
(ii) Bearish MACD cross
• Symbol: Red Dot (•) on the Bottom
• Event: MACD crosses below its signal line
■ SMA CROSSOVERS
The SMA crossovers are visualized by (X). By default, 50 periods for the fast SMA and 200 periods for the slow SMA (both are customizable).
NOTE: If you change the fast SMA to 1 period, the fast SMA becomes the closing price. Therefore, you can receive signals when the price crosses a key MA, for example, SMA(200).
(i) Bullish SMA Cross
• Symbol: Green (X) on the Top
• Event: The fast SMA crosses above the Slow SMA
(ii) Bearish RSI Cross
• Symbol: Red (X) on the Bottom
• Event: The fast SMA crosses below the Slow SMA
You can adjust the periods for both SMAs (Settings).
■ RSI CROSSOVER/CROSSUNDER
This signal corresponds to a bullish/bearish RSI Precision cross. By default, it is 5 for a bullish crossover and 100 for a bearish crossunder. Of course, these numbers are indicative and can be customized.
(i) Bullish RSI Precision Cross
• Symbol: Green arrow (▲) on the Top
• Event: The RSI Precision crosses above level 5
(ii) Bearish RSI Precision Cross
• Symbol: Red arrow (▼) on the Bottom
• Event: The RSI Precision crosses below level 100
■ RSI PRECISION MISSION
To enhance RSI and make it more accurate on longer time frames, choppy market conditions, and especially during market tops/bottoms.
■ RSI PRECISION OBJECTIVES
(1) identify overbought/oversold market levels in a simple and user-friendly manner
(2) make precise calculations near market tops and bottoms, where price volatility is always booming
(3) make precise calculations on longer time frames (monthly, weekly) where RSI readings are hardly readable
(4) offer three types of trading signals (RSI, MACD, SMA)
■ RSI PRECISION CALCULATIONS
The RSI PRECISION formula consists of 3 different modules:
(a) Relative Strength Index readings
(b) Price Volatility module
(c) RSI Volatility module (optional)
■ BASIC SETTINGS
--RSI PERIODS: -By default, 14.
---RSI PRECISION FORMULA
(i) RSI FACTOR (%)
-You can adjust the weight of RSI readings in the formula.
-By default, 100%.
(ii) PERIODIC PRICE VOLATILITY (%)
-You can adjust the weight of Periodic Price Volatility in the formula.
-By default, 100%.
(iii) RSI VOLATILITY (%)
-This is an extra measurement of volatility. This time the focus is exclusively on periodic RSI volatility, not on price volatility.
-By default, 5%.
--RSI CROSSOVER/CROSSUNDER LEVELS
You can adjust the levels for an RSI PRECISION crossover/crossunder.
- By default, 5 for a bullish crossover and 100 for a bearish crossunder.
--PERIODS FOR SMA CROSSOVERS
You can adjust the periods for the two SMAs.
-By default, 50 periods for the fast SMA and 200 periods for the slow SMA. Some traders describe the crossing of these two SMAs (50/200) as the “Golden/Death Crosses”.
■ FINAL THOUGHTS
The new RSI Precision combines everything in one place. I have been using this enhanced version, myself, as my only oscillator.
As always, happy trading... and remember to make charts, not war.
□ Giorgos Protonotarios,
Financial Analyst, Building Web
(March 2022)

Reversal Radars — Berk v2.0 (Bottom & Top)1) Combined script (Dip+Tepe)
Title:
Reversal Radars — Berk v2.0 (Bottom & Top)
Description (EN):
What it does
Two high-probability reversal detectors in one indicator: a Bottom Reversal Radar (long bias) and a Top Reversal Radar (short/hedge bias). Each radar aggregates multiple conditions into a single score and triggers when Score ≥ Threshold.
How it works
RSI regime shift: Bottom = recovery after oversold (touched 30, crosses up 35). Top = roll-over from overbought (touched 70, crosses down 65).
MACD cross: Bull (up) for bottoms, Bear (down) for tops.
EMA8 filter: Close above (bottom) / below (top) EMA(8).
Structure break (BOS): Close above recent swing high / below recent swing low (lookbackBars, using precomputed highest/lowest to avoid inconsistencies).
EMA200 proximity: Price within a configurable band (default −5% … +2%).
Volume expansion: Volume ≥ SMA(20) × multiplier (default 1.5×).
Divergence: Pivot-confirmed (3/3) bullish (bottom) or bearish (top) RSI divergence.
Scoring: RSI shift +2, divergence +2, MACD +1, EMA8 +1, BOS +1, Volume +1, EMA200 band +1.
Signals & Alerts
Bottom: label “DÖNÜŞ↑” and alert “Dipten Dönüş — Ana Sinyal” when scoreLong ≥ thrLong.
Top: label “DÖNÜŞ↓” and alert “Tepeden Dönüş — Ana Sinyal” when scoreShort ≥ thrShort.
Use Once per bar close for stable alerts.
Inputs
lenRSI, rsiOS=30, rsiRecover=35, rsiOB=70, rsiFall=65, volLen=20, volMult=1.5, lookbackBars=5, ema200 band (−5…+2%), thrLong/thrShort, toggles for Bottom/Top.
Timeframes & tips
Best on Daily/4H. Tighten thresholds (e.g., 4) and raise volume multiplier (1.8–2.0×) on lower TFs or thin liquidity.
No-repaint note
Evaluated on bar close; pivot divergences confirm with a natural ~3-bar delay.
Disclaimer
Educational use only. Not financial advice.
Tags: reversal, divergence, rsi, macd, ema, volume, trend, screener, stocks, crypto, bist
2) Bottom-only (Dip)
Title:
Bottom Reversal Radar — Berk v1.4
Description (EN):
Purpose
Scores bottoming conditions and triggers when Score ≥ Threshold (default 3).
Components
RSI recovery after oversold (30→35), MACD bull cross, close above EMA8, BOS above recent swing high, near-EMA200 band (−5…+2%), volume ≥ SMA(20)×1.5, and pivot-confirmed (3/3) bullish RSI divergence. Weights: RSI +2, Divergence +2, others +1.
Usage
Add to chart, set alert “Dipten Dönüş — Ana Sinyal”, Once per bar close. Works on any timeframe (need ≥200 bars for EMA200). Daily/4H recommended.
No-repaint
Bar-close evaluation; divergence confirms with ~3 bars.
Tags: bottom, reversal, rsi, macd, ema, volume, divergence
3) Top-only (Tepe)
Title:
Top Reversal Radar — Berk v1.0
Description (EN):
Purpose
Detects topping risk and triggers when Score ≥ Threshold (default 3) for exits/hedges.
Components
RSI roll-over from overbought (70→65), MACD bear cross, close below EMA8, BOS below recent swing low, near-EMA200 band, volume ≥ SMA(20)×1.5, and pivot-confirmed (3/3) bearish RSI divergence. Weights: RSI +2, Divergence +2, others +1.
Usage
Add to chart, set alert “Tepeden Dönüş — Ana Sinyal”, Once per bar close. Daily/4H preferred; tighten thresholds on lower TFs.
No-repaint
Bar-close evaluation; divergence confirms with ~3 bars.
Tags: top, reversal, rsi, macd, ema, volume, divergence

SDR Market Structure (liv3) 1.0🧠 SDR Market Structure (LIV3) v1.0
Precision-Based Market Structure & Momentum Scalping
Strategy Type: Market Structure-Based Scalping
Built For: Intraday, Scalping, Trend-Following or Reversal entries with confirmation filters
Assets: All (optimized for FX and indices)
Timeframes: 1min to 15min (ideal for scalping); higher TFs can be used for structure alignment
🎯 Strategy Overview
SDR Market Structure is a robust scalping strategy that combines structural market context (Change-of-Character, Break of Structure) with a modular system of technical filters that advanced traders can toggle on/off. The strategy is adaptable and surgical, designed to find high-probability trade entries during momentum shifts, liquidity grabs, and trend continuations.
This script supports fine-tuned risk management, multiple confirmation layers, and intraday session filtering, allowing experienced traders to tailor it for precision-based trading in varying volatility regimes.
🔍 Core Logic: CHoCH and Market Structure
At the heart of SDR Scalper is Change-of-Character (CHoCH) detection:
Bullish CHoCH: Occurs when price breaks above a recent swing high (pivot) after making a lower low, implying a potential reversal or continuation.
Bearish CHoCH: Triggers when price breaks below a recent swing low after making a higher high.
Once a CHoCH is identified:
Entry is confirmed only if all selected filters pass, ensuring high-confidence setups.
SL is placed at the most recent swing low/high or an optional looser SL based on fractals.
Break-even logic moves SL to entry upon hitting 1R.
Risk-Reward ratio is fully customizable.
🛠️ Advanced Filter Modules
Each filter module below can be toggled independently, allowing for custom filtering strategies based on trading conditions.
1️⃣ HTF EMA Filter
Purpose: Confirms trend bias using a higher timeframe EMA (e.g., 55 EMA on 15-min TF).
Logic:
Longs: Entry only allowed if price > HTF EMA
Shorts: Entry only allowed if price < HTF EMA
Why Use It: Prevents counter-trend trades. Excellent when used during trending sessions.
Best Paired With: EMA crossover filter or RSI for intraday trend alignment.
2️⃣ EMA Crossover Filter
Inputs: Fast EMA (default 10), Slow EMA (default 50)
Logic:
Longs: Fast EMA must be above Slow EMA
Shorts: Fast EMA below Slow EMA
Enhancement: Adds a moving average structure filter to CHoCH. Good for filtering false breakouts during sideways markets.
Combo Tip: Use alongside RSI/MACD filters to confirm trend momentum.
3️⃣ RSI Filter
Default Period: 14
Logic:
Longs: RSI > threshold (default 50)
Shorts: RSI < threshold
Edge: Useful for momentum confirmation in trending conditions.
Advanced Use:
Raise thresholds to 60/40 in strong trends.
Combine with MACD to filter momentum exhaustion.
4️⃣ MACD Histogram Filter
MACD Histogram > 0: Long entries only
MACD Histogram < 0: Short entries only
Purpose: Measures positive/negative momentum shifts, helpful in volatile breakouts.
Pro Tip: Combine with ROC filter in fast-moving markets for maximum edge.
5️⃣ Rate of Change (ROC) Filter
Default: 9-period
Logic:
Longs: ROC > threshold (default 0.0)
Shorts: ROC < threshold
Why It Works: Captures short bursts of momentum often missed by other lagging indicators.
Combos That Work:
MACD + ROC: Double momentum filter
ROC + EMA crossover: Catch high-speed trend continuations
6️⃣ Stochastic RSI Filter
Parameters: Customizable %K and %D smoothing
Logic:
Longs: StochRSI > threshold and K > D
Shorts: StochRSI < threshold and K < D
Use Case: Effective for mean-reversion and momentum crossovers near S/R zones.
Advanced Tip: Use in ranging markets or to fade extended trends.
7️⃣ Time Filter
Customize Start/End Time: Default is 09:30 - 16:00 (New York session)
Supports Time Zones: Input via string (e.g., GMT+0, EST, etc.)
Visual Aid: Background shading for valid sessions.
Benefits:
Avoids low-liquidity or overnight trading periods.
Prevents false signals in pre/post-market sessions.
8️⃣ Loose Stop-Loss Option
If Enabled: SL placed 1 fractal beyond the last pivot.
Why: Helps in volatile assets like crypto where swing points are commonly breached before reversals.
Note: Should be used with tight risk controls or lower position sizing.
💼 Risk Management & Break-Even Logic
Risk-to-Reward Ratio: Adjustable via input
Auto TP & SL: Based on defined RR and recent structure
Break-Even Feature: Moves SL to entry after 1R is reached to protect capital
📈 Strategy Display Elements
CHoCH & BoS Labels: Visual confirmation of structure breaks
Liquidity Sweep (✖): Optional display for potential stop hunts
Trend Color Candles: Highlights bullish or bearish candle clusters
Session Overlay: Displays active time window on chart
⚙️ Recommended Configurations
Objective Suggested Filters
Trend Scalping HTF EMA + EMA Crossover + RSI
Volatility Breakouts ROC + MACD Histogram + Time Filter
Mean Reversion Stochastic RSI + RSI
Structure-Only Mode Disable all filters except Time Filter
Conservative Mode Enable all filters with tightened thresholds
📌 Final Notes
This script is highly modular and is not a one-size-fits-all strategy. It is a framework that allows advanced traders to apply contextual judgment and optimize entries based on confluence. Extensive backtesting per asset and timeframe is highly recommended.
🛠️ Strategy Parameters Summary
✅ Market Structure Entry (CHoCH)
✅ Smart SL & Break-Even Logic
✅ Modular Momentum Filters (RSI, MACD, ROC, StochRSI)
✅ Trend Filters (HTF EMA, EMA Cross)
✅ Session Filtering & Visualization
✅ Liquidity Sweeps (optional)
pinescript version5

Canuck Trading IndicatorOverview
The Canuck Trading Indicator is a versatile, overlay-based technical analysis tool designed to assist traders in identifying potential trading opportunities across various timeframes and market conditions. By combining multiple technical indicators—such as RSI, Bollinger Bands, EMAs, VWAP, MACD, Stochastic RSI, ADX, HMA, and candlestick patterns—the indicator provides clear visual signals for bullish and bearish entries, breakouts, long-term trends, and options strategies like cash-secured puts, straddles/strangles, iron condors, and short squeezes. It also incorporates 20-day and 200-day SMAs to detect Golden/Death Crosses and price positioning relative to these moving averages. A dynamic table displays key metrics, and customizable alerts help traders stay informed of market conditions.
Key Features
Multi-Timeframe Adaptability: Automatically adjusts parameters (e.g., ATR multiplier, ADX period, HMA length) based on the chart's timeframe (minute, hourly, daily, weekly, monthly) for optimal performance.
Comprehensive Signal Generation: Identifies short-term entries, breakouts, long-term bullish trends, and options strategies using a combination of momentum, trend, volatility, and candlestick patterns.
Candlestick Pattern Detection: Recognizes bullish/bearish engulfing, hammer, shooting star, doji, and strong candles for precise entry/exit signals.
Moving Average Analysis: Plots 20-day and 200-day SMAs, detects Golden/Death Crosses, and evaluates price position relative to these averages.
Dynamic Table: Displays real-time metrics, including zone status (bullish, bearish, neutral), RSI, MACD, Stochastic RSI, short/long-term trends, candlestick patterns, ADX, ROC, VWAP slope, and MA positioning.
Customizable Alerts: Over 20 alert conditions for entries, exits, overbought/oversold warnings, and MA crosses, with actionable messages including ticker, price, and suggested strategies.
Visual Clarity: Uses distinct shapes, colors, and sizes to plot signals (e.g., green triangles for bullish entries, red triangles for bearish entries) and overlays key levels like EMA, VWAP, Bollinger Bands, support/resistance, and HMA.
Options Strategy Signals: Suggests opportunities for selling cash-secured puts, straddles/strangles, iron condors, and capitalizing on short squeezes.
How to Use
Add to Chart: Apply the indicator to any TradingView chart by selecting "Canuck Trading Indicator" from the Pine Script library.
Interpret Signals:
Bullish Signals: Green triangles (short-term entry), lime diamonds (breakout), blue circles (long-term entry).
Bearish Signals: Red triangles (short-term entry), maroon diamonds (breakout).
Options Strategies: Purple squares (cash-secured puts), yellow circles (straddles/strangles), orange crosses (iron condors), white arrows (short squeezes).
Exits: X-cross shapes in corresponding colors indicate exit signals.
Monitor: Gray circles suggest holding cash or monitoring for setups.
Review Table: Check the top-right table for real-time metrics, including zone status, RSI, MACD, trends, and MA positioning.
Set Alerts: Configure alerts for specific signals (e.g., "Short-Term Bullish Entry" or "Golden Cross") to receive notifications via TradingView.
Adjust Inputs: Customize input parameters (e.g., RSI period, EMA length, ATR period) to suit your trading style or market conditions.
Input Parameters
The indicator offers a wide range of customizable inputs to fine-tune its behavior:
RSI Period (default: 14): Length for RSI calculation.
RSI Bullish Low/High (default: 35/70): RSI thresholds for bullish signals.
RSI Bearish High (default: 65): RSI threshold for bearish signals.
EMA Period (default: 15): Main EMA length (15 for day trading, 50 for swing).
Short/Long EMA Length (default: 3/20): For momentum oscillator.
T3 Smoothing Length (default: 5): Smooths momentum signals.
Long-Term EMA/RSI Length (default: 20/15): For long-term trend analysis.
Support/Resistance Lookback (default: 5): Periods for support/resistance levels.
MACD Fast/Slow/Signal (default: 12/26/9): MACD parameters.
Bollinger Bands Period/StdDev (default: 15/2): BB settings.
Stochastic RSI Period/Smoothing (default: 14/3/3): Stochastic RSI settings.
Uptrend/Short-Term/Long-Term Lookback (default: 2/2/5): Candles for trend detection.
ATR Period (default: 14): For volatility and price targets.
VWAP Sensitivity (default: 0.1%): Threshold for VWAP-based signals.
Volume Oscillator Period (default: 14): For volume surge detection.
Pattern Detection Threshold (default: 0.3%): Sensitivity for candlestick patterns.
ROC Period (default: 3): Rate of change for momentum.
VWAP Slope Period (default: 5): For VWAP trend analysis.
TradingView Publishing Compliance
Originality: The Canuck Trading Indicator is an original script, combining multiple technical indicators and custom logic to provide unique trading signals. It does not replicate existing public scripts.
No Guaranteed Profits: This indicator is a tool for technical analysis and does not guarantee profits. Trading involves risks, and users should conduct their own research and risk management.
Clear Instructions: The description and usage guide are detailed and accessible, ensuring users understand how to apply the indicator effectively.
No External Dependencies: The script uses only built-in Pine Script functions (e.g., ta.rsi, ta.ema, ta.vwap) and requires no external libraries or data sources.
Performance: The script is optimized for performance, using efficient calculations and adaptive parameters to minimize lag on various timeframes.
Visual Clarity: Signals are plotted with distinct shapes and colors, and the table provides a concise summary of market conditions, enhancing usability.
Limitations and Risks
Market Conditions: The indicator may generate false signals in choppy or low-liquidity markets. Always confirm signals with additional analysis.
Timeframe Sensitivity: Performance varies by timeframe; test settings on your preferred chart (e.g., 5-minute for day trading, daily for swing trading).
Risk Management: Use stop-losses and position sizing to manage risk, as suggested in alert messages (e.g., "Stop -20%").
Options Trading: Options strategies (e.g., straddles, iron condors) carry unique risks; consult a financial advisor before trading.
Feedback and Support
For questions, suggestions, or bug reports, please leave a comment on the TradingView script page or contact the author via TradingView. Your feedback helps improve the indicator for the community.
Disclaimer
The Canuck Trading Indicator is provided for educational and informational purposes only. It is not financial advice. Trading involves significant risks, and past performance is not indicative of future results. Always perform your own due diligence and consult a qualified financial advisor before making trading decisions.

MLB Momentum IndicatorMLB Momentum Indicator is a no‐lookahead technical indicator designed to signal intraday trend shifts and potential reversal points. It combines several well‐known technical components—Moving Averages, MACD, RSI, and optional ADX & Volume filters—to deliver high‐probability buy/sell signals on your chart.
Below is an overview of how it works and what each part does:
1. Moving Average Trend Filter
The script uses two moving averages (fast and slow) to determine the primary trend:
isUpTrend if Fast MA > Slow MA
isDownTrend if Fast MA < Slow MA
You can select the MA method—SMA, EMA, or WMA—and customize lengths.
Why it matters: The indicator only gives bullish signals if the trend is up, and bearish signals if the trend is down, helping avoid trades that go against the bigger flow.
2. MACD Confirmation (Momentum)
Uses MACD (with user‐defined Fast, Slow, and Signal lengths) to check momentum:
macdBuySignal if the MACD line crosses above its signal line (bullish)
macdSellSignal if the MACD line crosses below its signal line (bearish)
Why it matters: MACD crossovers confirm an emerging momentum shift, aligning signals with actual price acceleration rather than random fluctuation.
3. RSI Overbought/Oversold Filter
RSI (Relative Strength Index) is calculated with a chosen length, plus Overbought & Oversold thresholds:
For long signals: the RSI must be below the Overbought threshold (e.g. 70).
For short signals: the RSI must be above the Oversold threshold (e.g. 30).
Why it matters: Prevents buying when price is already overbought or shorting when price is too oversold, filtering out possible poor‐risk trades.
4. Optional ADX Filter (Trend Strength)
If enabled, ADX must exceed a chosen threshold (e.g., 20) for a signal to be valid:
This ensures you’re only taking trades in markets that have sufficient directional momentum.
Why it matters: It weeds out choppy, sideways conditions where signals are unreliable.
5. Optional Volume Filter (High‐Participation Moves)
If enabled, the indicator checks whether current volume is above a certain multiple of its moving average (e.g., 1.5× average volume).
Why it matters: High volume often indicates stronger institutional interest, validating potential breakouts or reversals.
6. ATR & Chandelier (Visual Reference)
For reference only, the script can display ATR‐based stop levels or a Chandelier Exit line:
ATR (Average True Range) helps gauge volatility and can inform stop‐loss distances.
Chandelier Exit is a trailing stop technique that adjusts automatically as price moves.
Why it matters: Though this version of the script doesn’t execute trades, these lines help you see how far to place stops or how to ride a trend.
7. Final Bullish / Bearish Signal
When all conditions (trend, MACD, RSI, optional ADX, optional Volume) line up for a long, a green “Long” arrow appears.
When all conditions line up for a short, a red “Short” arrow appears.
Why it matters: You get a clear, on‐chart signal for each potential entry, rather than needing to check multiple indicators manually.
8. Session & Date Filtering
The script allows choosing a start/end date and an optional session window (e.g. 09:30–16:00).
Why it matters: Helps limit signals to a specific historical backtest range or trading hours, which can be crucial for day traders (e.g., stock market hours only).
Putting It All Together
Primary Trend → ensures you trade in line with the bigger direction.
MACD & RSI → confirm momentum and avoid overbought/oversold extremes.
ADX & Volume → optional filters for strong trend strength & genuine interest.
Arrows → each potential buy (Long) or sell (Short) signal is clearly shown on your chart.
Use Cases
5‐Minute Scalping: Shorter RSI/MACD lengths to catch small, frequent intraday moves.
Swing Trading: Larger MAs, bigger RSI thresholds, and using ADX to filter only major trends.
Cautious Approach: Enable volume & ADX filters to reduce false signals in choppy markets.
Benefits & Limitations
Benefits:
Consolidates multiple indicators into one overlay.
Clear buy/sell signals with optional dynamic volatility references.
Flexible user inputs adapt to different trading styles/timeframes.
Limitations:
Like all technical indicators, it can produce false signals in sideways or news‐driven markets.
Success depends heavily on user settings and the particular market’s behavior.
Summary
The MLB Momentum Indicator combines a trend filter (MAs), momentum check (MACD), overbought/oversold gating (RSI), and optional ADX/Volume filters to create clear buy/sell arrows on your chart. This approach encourages trading in sync with both trend and momentum, and helps avoid suboptimal entries when volume or trend strength is lacking. It can be tailored to scalp micro‐moves on lower timeframes or used for higher‐timeframe swing trading by adjusting the input settings.

SufinBDThis TradingView script combines RSI, Stochastic RSI, MACD, and Bollinger Bands to generate Buy and Sell signals on two different timeframes: 4-hour (4H) and Daily (1D). The strategy aims to provide entry and exit points based on a multi-indicator confirmation approach, helping traders make more informed decisions.
Features:
RSI (Relative Strength Index):
Measures the speed and change of price movements.
The script looks for oversold conditions (RSI below 30) for buy signals and overbought conditions (RSI above 70) for sell signals.
Stochastic RSI:
Measures the level of RSI relative to its high-low range over a given period.
A Stochastic RSI below 0.2 indicates oversold conditions, and a value above 0.8 indicates overbought conditions.
It helps identify overbought and oversold conditions in a more precise manner than regular RSI.
MACD (Moving Average Convergence Divergence):
A trend-following momentum indicator that shows the relationship between two moving averages of a security's price.
The MACD line crossing above the Signal line generates bullish signals, and vice versa for bearish signals.
Bollinger Bands:
A volatility indicator that consists of a middle band (SMA of price), an upper band, and a lower band.
When the price is below the lower band, it signals potential buy opportunities, while prices above the upper band signal potential sell opportunities.
Timeframe Usage:
The script calculates indicators for both the 4-hour (4H) and Daily (1D) timeframes.
The combined signals from these two timeframes are used to generate Buy and Sell alerts.
Buy Signal:
A Buy signal is generated when all of the following conditions are met:
RSI on both 4H and 1D is below 30 (oversold conditions).
Stochastic RSI on both timeframes is below 0.2.
The MACD line is above the Signal line on both timeframes.
The price is below the lower Bollinger Band on both the 4H and 1D charts.
Sell Signal:
A Sell signal is generated when all of the following conditions are met:
RSI on both 4H and 1D is above 70 (overbought conditions).
Stochastic RSI on both timeframes is above 0.8.
The MACD line is below the Signal line on both timeframes.
The price is above the upper Bollinger Band on both the 4H and 1D charts.
Visuals:
Buy signals are marked with green labels below the bars.
Sell signals are marked with red labels above the bars.
Bollinger Bands are displayed on the chart with the upper and lower bands marked in blue (for 4H) and orange (for 1D).
Purpose:
This script aims to provide more reliable buy/sell signals by combining indicators across multiple timeframes. It is ideal for traders who want to use multiple confirmation points before entering or exiting a trade.
How to Use:
Apply the script to any chart on TradingView.
Look for Buy and Sell signals that meet the conditions above.
You can adjust the timeframe (e.g., 4H or 1D) based on your trading strategy.
This script can be used for intraday trading, swing trading, or position trading depending on your preferred timeframes.
Example of Signal Interpretation:
Buy Signal:
If all conditions are met (e.g., RSI is under 30, Stochastic RSI is under 0.2, MACD is bullish, and price is below the lower Bollinger Band on both the 4-hour and daily charts), the script will show a green "BUY" label below the price bar.
Sell Signal:
If all conditions are met (e.g., RSI is over 70, Stochastic RSI is over 0.8, MACD is bearish, and price is above the upper Bollinger Band on both timeframes), the script will show a red "SELL" label above the price bar.
This combination of indicators offers a multi-layered confirmation approach, which aims to reduce the risk of false signals and increase the reliability of your trading decisions.

Bullish/Bearish Sentiment Cycle Indicator Sentiment Cycle Indicator: Understanding Market Psychology Through Technical Analysis
Overview:
The Sentiment Cycle Indicator is a unique blend of multiple technical analysis tools designed to help traders visualize and capitalize on market sentiment shifts. This indicator combines RSI (Relative Strength Index), MACD (Moving Average Convergence Divergence), volume analysis, and sentiment cycle detection to provide actionable buy and sell signals. By monitoring the emotional stages that market participants go through—such as optimism, excitement, euphoria, anxiety, denial, panic, and depression—this indicator helps traders identify turning points in the market cycle.
Key Components and How They Work Together:
1. RSI (Relative Strength Index):
• The RSI is a momentum oscillator that measures the speed and change of price movements. In this indicator, the RSI is used to determine overbought or oversold conditions, which are then translated into signals for potential market sentiment shifts.
• Integration: The RSI provides the foundational layer to assess whether the market is generally bullish or bearish. When combined with MACD and volume analysis, it helps confirm the strength of a sentiment cycle phase.
2. MACD (Moving Average Convergence Divergence):
• MACD is a trend-following indicator that shows the relationship between two moving averages of a security’s price. It is used in this script to identify trend direction and momentum changes.
• Integration: MACD crossovers are aligned with RSI conditions to detect the shift between bullish and bearish market sentiments. The MACD’s ability to capture trend changes strengthens the identification of sentiment phases, such as “optimism” or “panic.”
3. Volume Analysis:
• Volume analysis is a critical component in understanding market sentiment. The indicator uses a moving average of volume to detect volume spikes, which often coincide with significant market moves or reversals.
• Integration: Volume spikes are used to gauge the intensity of sentiment changes. For example, high volume during a bullish or bearish sentiment phase is a strong confirmation of a market sentiment shift. This integration enhances the reliability of the buy and sell signals generated by the sentiment cycle logic.
4. Sentiment Cycles:
• The indicator identifies four main sentiment phases—Optimism, Excitement, Panic, and Depression—based on combinations of RSI, MACD, and volume data. These phases are visually represented on the chart through background color zones, allowing traders to see the prevailing market sentiment at a glance.
• Integration: The sentiment phases are determined by a combination of the RSI trend, MACD crossovers, and volume analysis. For example, a transition from “Panic” to “Optimism” is detected when the RSI recovers from oversold levels, MACD turns bullish, and volume spikes decrease. This comprehensive approach ensures that all signals are well-founded and based on multiple dimensions of market data.
5. Buy and Sell Signals:
• The buy and sell signals are generated based on crossovers and crossunders between sentiment phases. For example, a buy signal is triggered when the market moves from a “Depression” (oversold) phase to an “Optimism” phase. A sell signal is triggered when the market transitions from “Excitement” to “Panic.”
• Integration: These signals are refined by adding a minimum distance between consecutive signals to avoid noise and enhance the clarity of trading opportunities. This further ensures that signals are not generated too frequently, reducing the chance of false positives.
Justification for Combining These Components:
The combination of RSI, MACD, volume analysis, and sentiment detection into a single indicator offers a holistic approach to understanding market psychology. Here’s why this mashup is particularly effective:
• Comprehensive Sentiment Analysis: The integration of RSI and MACD provides a well-rounded view of both momentum and trend, while volume analysis adds a layer of intensity to confirm sentiment shifts.
• Reduced Noise and Enhanced Signal Quality: By using multiple indicators to filter signals, the indicator minimizes noise and reduces the likelihood of false signals. This is particularly beneficial for traders looking to capitalize on meaningful market turns rather than being whipsawed by minor fluctuations.
• Visual Clarity: The background color zones corresponding to different sentiment phases offer a clear, at-a-glance view of the market’s current state, allowing traders to make more informed decisions quickly.
• Unique Combination for Market Sentiment Detection: While many indicators focus on either trend, momentum, or volume independently, this mashup uniquely combines these elements to detect the market’s underlying emotional state, providing a more nuanced understanding of market behavior.
How to Use This Indicator:
• Buy Signal: Look for the green “Buy” label when the market transitions from a bearish sentiment (grey or red zones) to a bullish sentiment (green zone).
• Sell Signal: Look for the red “Sell” label when the market transitions from a bullish sentiment (blue zone) to a bearish sentiment (red or gray zones).
• Dynamic Background Zones: Use the background color zones to visually track the prevailing market sentiment phase and anticipate potential buy or sell signals.
Originality and Practical Application:
This indicator’s originality lies in its ability to seamlessly integrate multiple widely-used technical analysis tools (RSI, MACD, and Volume) into a single, comprehensive tool for detecting market sentiment shifts. By doing so, it provides traders with a practical, easy-to-use tool that adapts to various market conditions, making it suitable for both day trading and longer-term strategies.
Conclusion:
The “Sentiment Cycle Indicator” is designed to offer traders a powerful, unified approach to identifying market sentiment shifts. By combining momentum, trend, and volume analysis, it delivers a unique and efficient way to navigate the complexities of market psychology, ultimately providing traders with an edge in understanding and predicting market movements.

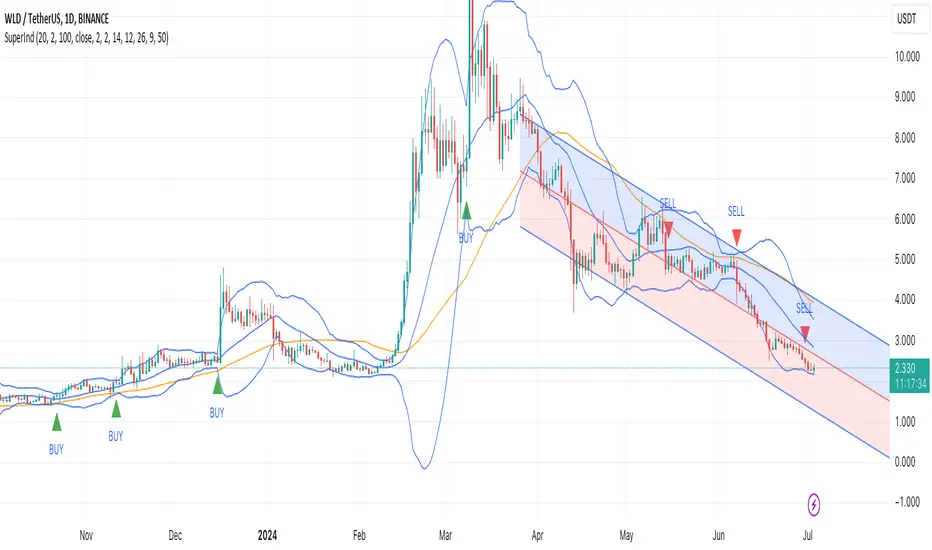
Super IndicatorOverview of the Combined Indicator
This combined indicator leverages three major technical analysis tools:
Bollinger Bands
Linear Regression Channels
Scalping Strategy Indicators (RSI, MACD, SMA)
Each of these tools provides unique insights into market conditions, and their integration offers a comprehensive view of price movements, trends, and potential trading signals.
1. Bollinger Bands
Purpose:
Bollinger Bands are used to measure market volatility and identify overbought or oversold conditions.
Components:
Basis (Middle Band): Typically a 20-period Simple Moving Average (SMA).
Upper Band: Basis + (2 * Standard Deviation).
Lower Band: Basis - (2 * Standard Deviation).
Why They Complement:
Bollinger Bands expand and contract based on market volatility. When the bands are narrow, it indicates low volatility and potential for a significant move. Wide bands indicate high volatility. This helps traders gauge the strength of market moves and potential reversals.
2. Linear Regression Channels
Purpose:
Linear Regression Channels identify the overall trend direction and measure deviation from the mean price over a specific period.
Components:
Middle Line (Linear Regression Line): The line of best fit through the price data over a specified period.
Upper and Lower Lines: Channels created by adding/subtracting a multiple of the standard deviation or another deviation measure from the regression line.
Why They Complement:
Linear Regression Channels provide a clear visual representation of the trend direction and the range within which prices typically fluctuate. This can help traders identify trend continuations and reversals, making it easier to spot entry and exit points.
3. Scalping Strategy Indicators
Purpose:
The RSI, MACD, and SMA are used to generate short-term buy and sell signals, which are essential for scalping strategies aimed at capturing quick profits from small price movements.
Components:
RSI (Relative Strength Index): Measures the speed and change of price movements, typically over 14 periods. It helps identify overbought and oversold conditions.
MACD (Moving Average Convergence Divergence): Consists of the MACD line, Signal line, and histogram. It helps identify changes in the strength, direction, momentum, and duration of a trend.
SMA (Simple Moving Average): The average price over a specified period, used to smooth out price data and identify trends.
Why They Complement:
These indicators provide short-term signals that can confirm or refute the signals given by Bollinger Bands and Linear Regression Channels. For example, a buy signal might be more reliable if the price is near the lower Bollinger Band and the MACD crosses above its signal line.
How They Work Together
Scenario 1: Confirming Trend Continuations
Bollinger Bands: Price staying near the upper band suggests a strong uptrend.
Linear Regression Channels: Price staying above the middle line confirms the uptrend.
5-Minute Scalping Strategy: RSI not in overbought territory, and MACD showing bullish momentum confirms continuation.
Scenario 2: Identifying Reversals
Bollinger Bands: Price touching or moving outside the lower band suggests oversold conditions.
Linear Regression Channels: Price at the lower channel line indicates potential support.
5-Minute Scalping Strategy: RSI in oversold territory, and MACD showing a bullish crossover indicates a reversal.
Scenario 3: Volatility Breakouts
Bollinger Bands: Bands contracting indicates low volatility and potential breakout.
Linear Regression Channels: Price moving away from the middle line signals potential breakout direction.
Scalping Strategy: MACD and RSI confirming the breakout direction for entry.
Input Parameters:
Define settings for Bollinger Bands, Linear Regression Channels, and the scalping strategy.
Allow users to customize lengths, multipliers, and colors.
Bollinger Bands Calculation:
Calculate the basis (SMA) and standard deviation.
Derive the upper and lower bands from the basis and standard deviation.
Linear Regression Channel Calculation:
Compute the slope, average, and intercept of the linear regression line.
Calculate deviations to plot upper and lower channel lines.
5-Minute Scalping Strategy:
Calculate RSI, MACD, and SMA for short-term trend analysis.
Define buy and sell conditions based on these indicators.
Plotting and Alerts:
Plot Bollinger Bands and Linear Regression Channels on the chart.
Plot buy and sell signals with shapes.
Set alerts for key conditions like exiting the regression channel bounds and trend switches.
Conclusion
By combining Bollinger Bands, Linear Regression Channels, and a 5-minute scalping strategy, this indicator offers a robust tool for traders. Bollinger Bands provide volatility insights, Linear Regression Channels highlight trend direction and potential reversals, and the scalping strategy offers precise entry and exit points. Together, these tools can enhance a trader's ability to make informed decisions in various market conditions.
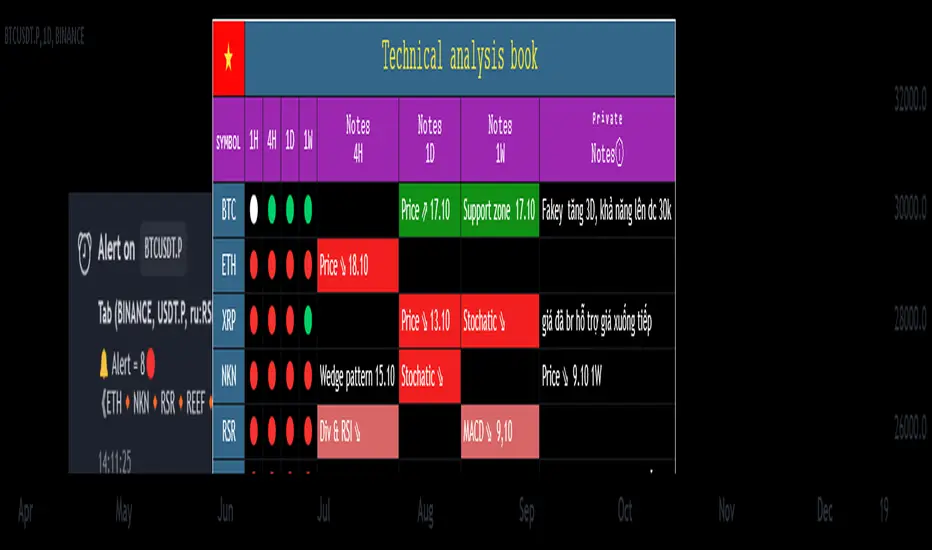
Technical Analysis Notes👉 Hello trader.
- In the process of monitoring the list of trading pairs such as stocks, cryptocurrencies... I often mark signals such as: RSI divergence, MACD, Stochatic, RSI trendline, Trendline..."by hand" , like recording on a drawing board, or excell, notepad... Therefore, taking notes is very limited. In addition, each time frame gives different, inconsistent signals and it is difficult to analyze the trend of a trading pair. somehow.
- After a period of careful research, I created the "Technical Analysis notes" indicator to solve the problems mentioned above, and after using it, I personally found it very effective to mark it. Trading signals as well as trend analysis across time frames from small to large.
- For example: On weekends, I often use automatic scanning indicators (about 200 codes) RSI divergence, RSI trendline, Trendlines, MACD-histogram .. within a week, then mark trading pairs when there are signals. Signals such as RSI cutting its trend line, price breaking through the trend line, Histogram MACD divergence... in the weekly frame, from there look to the D1, H4 frames to see the next signals in those frames to find the direction of intersection. Move in the same direction as the weekly frame signal to trade in the same trend. From that analysis, I limit my ability to go against the trend, and wait patiently for the signals that have been noted before.
- On this board you can monitor 10 transaction codes (in real time)
- On this table I have given 4 different time frames (can be customized in settings)
- I add Kumo Cloud (ichimoku) signals on 4 time frames so that people can easily recognize the trend when the price is above the cloud (green circle), in the cloud (white circle), below the cloud (green circle). red circle)
- I add fast typing mode, shortcut typing depending on each person's description including 16 fast typing modes (for example: "ru:RSI br up" in my understanding means the RSI line has broken above the trend line direction)
- From the above example "ru:RSI br up" the sign ' : ' is the separator that must be present to interpret the word 'ru' as being typed quickly, and 'RSI br up' is the part that explains the content of that word typed quickly.
- In those 16 quick typing boxes (divided into 4 rows), the first 3 rows are colored with custom boxes for each person. The last remaining row is not filled.
- The content of note boxes can be hidden in the settings using the check box.
- In particular, the private notes column cannot be hidden, because it is the column for recording, synthesizing, analyzing, identifying main trends, or waiting points to place orders... (This box is the most important in my opinion. ..)
- Has a super smart warning mode (customizable) when Kumo cloud signals are in the same color on 4 time frames for the most certain trend (green - bullish, red - bearish)
- In the warning section, you can adjust from 4 time frames to 3 time frames, 2 time frames, 1 time frame.
- Alert mode lists exact code names when one or more codes qualify. (eg BTC, ADA, BNB...)
--------------------------------------------------------------------------------------------------------------------
👉 Vietnamess
- Trong quá trình theo dõi danh sách các cặp giao dịch như cổ phiếu, tiền điện tử...tôi thường đánh dấu các tín hiệu như : phân kì RSI, MACD, Stochatic, trendline RSI, Trendline ..."bằng tay", như ghi trên bảng vẽ, hoặc excell, notepad...Vì vậy ghi chép rất hạn chế ngoài ra mỗi khung thời gian cho các tín hiệu khác nhau, không đồng nhất và rất khó để phân tích xu hướng của một cặp giao dịch nào đó.
- Sau một thời gian nghiên cứu kĩ lưỡng tôi có lập lên được chỉ báo "ghi chép Phân tích kĩ thuật " nhằm giải quyết các vấn đề nêu như trên, và sau quá trình dùng, cá nhân tôi thấy rất hiệu quả khi đánh dấu các tín hiệu giao dịch cũng như phân tích xu hướng qua các khung thời gian từ nhỏ đến lớn.
- Ví dụ: Cuối tuần tôi thường dùng chỉ báo quét tự động(khoảng 200 mã) RSI phân kì, RSI trendline, Trendlines , MACD-histogram .. trong khung 1 tuần, sau đó đánh dấu những cặp giao dịch khi có những tín hiệu như RSI cắt đường xu hướng của nó, giá đột phá đường xu hướng, phân kì Histogram MACD.. trong khung tuần, từ đó tìm đến những khung D1,H4 xem các tín hiệu tiếp theo trong các khung đó để tìm hướng giao dịch cùng hướng với tín hiệu khung tuần để giao dịch cùng xu hướng. Từ những phân tích đó tôi hạn chế được đi ngược xu hướng, và kiên nhẫn chờ đợi khi có tín hiệu được đã ghi chú từ trước.
- Trên bảng này có thể theo õi được 10 mã giao dịch(theo thời gian thực)
- Trên bảng này tôi có đưa ra 4 khung thời gian khác nhau(có thể tùy chỉnh trong thiết lập)
- Tôi đưa thêm tín hiệu Mây Kumo( ichimoku) trên 4 khung thời gian để mọi người từ đó dễ dàng nhận biết xu hướng khi giá trên mây(dấu tròn xanh lá) , trong mây(dấu tròn trắng) , dưới mây(dấu tròn đỏ)
- Tôi đưa thêm chế độ gõ nhanh, gõ tắt tùy theo diễn tả của mỗi người gồm 16 chế độ gõ nhanh (ví dụ: "ru:RSI br up" theo ý hiểu của tôi là đường RSI đã phá vỡ lên trên đường xu hướng)
- Từ ví dụ trên "ru:RSI br up" dấu ' : ' là ngăn cách phải có để diễn giải từ 'ru' là gõ nhanh, còn 'RSI br up' là phần diễn giải nội dung của từ gõ nhanh đó
- Trong 16 ô gõ nhanh đó(được chia làm 4 hàng) có 3 hàng đầu được tô màu ô tùy chỉnh cầu mỗi người. hàng cuối cùng còn lại không được tô.
- Nội dung các ô ghi chú có thể được ẩn hiện trong mục cài đặt bằng ô dấu tích.
- Đặc biệt cột ghi chú riêng tư không ẩn được, vì đó là cột ghi chép, tổng hợp , phân tích , nhận định xu hướng chính, hay điểm chờ để đặt lệnh...(ô này theo tôi là quan trọng nhất...)
- Có chế độ cảnh báo siêu thông minh(có thể tùy chỉnh) khi tín hiệu mây Kumo cùng trên 4 khung thời gian cùng màu cho xu hướng chắc chắn nhất(xanh- tăng giá, đỏ- giảm giá)
- Trong mục cảnh báo có thể điều chỉnh từ 4 khung thời gian xuống còn 3 khung thời gian, 2 khung thời gian, 1 khung thời gian.
- Chế độ cảnh báo được liệt kê tên mã chính xác khi một hay nhiều mã đủ điều kiện .(ví dụ BTC , ADA , BNB...)
Easy Trade Pro [Buy and Sell Strategy + Backtesting System]Hello Traders,
Easy Trade Pro is a comprehensive tool that combines multiple technical indicators into a single customizable one. This tool is the culmination of an extensive trading career, it is designed to help traders navigate the markets in any timeframe and financial asset, like Equities, Futures, Crypto, Forex and Commodities.
Before we deep dive into the comprehensive guide on what Easy Trade Pro is, let's kick off by showcasing the strategy used in this example. Please note, we have adopted an extremely conservative approach strictly following the Tradingview House Rules, which you can review here: www.tradingview.com
The backtest strategy parameters:
Currency pair: EUR USD
Timeframe: 15-min chart
Market: Spot, no leverage
Broker: FXCM
Trading range: 2022-09-01 07:30 — 2023-06-26 20:00
Backtesting range: 2022-08-31 23:00 — 2023-06-26 20:00
Initial Capital: $10,000
Buy Order Size: 20% of the capital, $2,000
Stop Loss: 0.50%
Sell orders: Four different take profits where we unload the position by 25% each time
Broker Fees: Commission set at 0.08$
Slippage: 10 ticks
Understanding FXCM Commissions and Setting Realistic Slippage for EUR/USD Spot Trading:
◉I would like to provide some clarity on the commission structure and slippage setting used in the study for trading the EUR/USD pair on the FXCM spot market. Based on the information available, FXCM charges a commission of $4.00 per standard lot (100,000) on both sides of the trade (meaning at open and close) for the EUR/USD pair. Since the study involve an order size of $2,000 USD, which is equivalent to 0.02 lots, the commission fee for one side of the trade (either buying or selling) would be calculated as $4.00 multiplied by 0.02, which is $0.08. This means that for each individual trade, whether it be a buy or sell, the commission fee would be $0.08.
◉As for slippage, it is crucial to account for the inherent uncertainty in the execution price due to market fluctuations. In the forex market, the EUR/USD pair is quoted with a precision of five decimal places, with the smallest price change being a "pipette" (0.00001). Given that slippage can vary based on market conditions, it is considered fair practice to use a slippage of around 10 ticks under normal market conditions for the EUR/USD pair. This allows for a more realistic representation of the execution price, especially in a liquid and fast-moving market such as forex.
More detailed information about FXCM fees structure in the link below:
docs.fxcorporate.com
Enter a Trade conditions:
For our buy order, we utilize a custom buy signal called 'Bullish Reversal'. A detailed explanation of this and other buy orders can be found later in the guide, specifically in section 1).
To enhance realism in our trading strategy, we have implemented a confirmation mechanism. When utilizing the strategy tester, you have the option to input a value to determine the number of confirmation candles to consider.
For example, if you set the input to 1, the system will check if the next candle following the signal meets the criteria for confirmation. If set to 2, the system will evaluate the second candle, and so on for higher values. The confirmation is determined by comparing the closing or opening price of the selected buy signal candle with the corresponding closing price of the confirmation candle.
In this case we choose as buy signal: 'Bullish Reversal' + 2 candle of confirmation
Exit a trade conditions:
On the sell side, we exit a trade in four different types of sell orders where we take profits. Inside '', you will encounter unique labels attributed to our custom sell signals. A detailed explanation of these sell orders can be found later in the guide, specifically in section 1). We used custom order called:
1TP 'Good Sell'
2TP 'Good Sell'
3TP 'Good Sell'
4TP 'Bearish Reversal' + 4 confirmation candles
Our confirmation logic, for sell signals, is applied only to 'Bearish Reversal' signal. The confirmation is determined by comparing the closing or opening price of the selected 'Bearish Reversal' candle with the corresponding closing price of the confirmation candle. In this case, we wait for the fourth candle from the 'Bearish Reversal' signal to confirm the sell trade.
Protect your capital:
This super-conservative study involves a clear low risk, with the use of $2,000, 20% of our capital. If the stop loss of 0.5% were triggered, we lose 10$, equating to 0.10% of $10,000 - thus affecting only 0.10% of our capital.
Super Conservative Approach & Results:
With 353 closed trades, we achieved a net profit of 2.03%, or $203.34$ relative to our initial $10,000 capital, and a win rate of 73.37%.
Less Conservative Approach & Results:
We could also consider increasing our risk to 0.5% of our capital per trade. We would maintain our stop loss at 0.50%, but we would need to use all our capital to enter the market. If the stop loss of 0.5% will be triggered, we would lose 50$, equating to 0.5% of $10,000.
In this scenario, our net profit would have increased to 10.15%, equivalent to $1015.
Please be aware:
While fully automated strategies can bring considerable advantages, they are not without their cons. For one, relying solely on an automated system may not take into account the potential confluence of other strategies or indicators, such as the significance of support and resistance zones. These elements often require a more nuanced, human understanding of the markets and cannot always be perfectly replicated by an algorithm.
Additionally, it's essential to remember that a significant percentage of traders are not consistently profitable. As such, prudent risk management, a conservative approach, and acceptance of a reasonable profit are crucial aspects of successful trading. While the allure of high returns can be tempting, the sustainability of your trading strategy should always take precedence. Achieving steady, reliable profits over time often outweighs the appeal of a risky, high-return strategy that could potentially lead to substantial losses.
So, while automation can be a powerful tool in your trading arsenal, it's also important to consider other strategies and factors. Always ensure you're managing your risk effectively and approaching trading with a realistic and informed perspective.
------------------------------------------------------------------------ Why Easy Trade Pro is Original? ----------------------------------------------------------------------------------
We developed Easy Trade Pro as a unique and comprehensive solution, and we decided to protect our code to preserve its originality. We invested significant time and effort into making it a realistic trading strategy simulator. The standout features that set Easy Trade Pro apart include:
☀ Versatile Stop Loss Mechanisms: Stop loss execution can be complex and often requires careful coding to work as intended. In most freely available open-source codes, stop losses are implemented using the Average True Range (ATR). ATR can be beneficial but has limitations:
☁ Lagging Indicator - Like most technical indicators, the ATR is a lagging indicator. This means it is based on past data, and so it may not accurately reflect future market volatility. If market conditions change rapidly, the ATR may not adjust quickly enough, potentially leading to suboptimal stop loss levels.
☁ No Directional Information - The ATR measures volatility, but it does not provide any indication of the direction of the trend. Therefore, it should not be used as a standalone tool for making trading decisions, but should be used in conjunction with other technical analysis tools that can provide directional cues.
☁ Inefficiency in Trending Markets - In strongly trending markets, ATR-based stops can sometimes be too far from the current price level. This could lead to larger losses if the price moves against your trade before hitting the stop loss. On the flip side, in less volatile, sideways markets, an ATR-based stop might be set too close to the entry point, leading to premature stop outs.
☁ Overoptimization Risk - If you're backtesting a trading strategy, there's a risk of overoptimizing your stop loss settings by fine-tuning them to past data. The best ATR multiplier that worked in the past might not necessarily work in the future, leading to potential performance issues.
☀ We countered these by implementing four different types of 'protect the trade' mechanisms:
✔ Fixed Percentage Stop Loss
✔ Trailing Stop Loss
✔ Stop Loss Moved to Entry Upon Reaching Certain Gain
✔ Stop Loss Moved to Entry Upon Reaching First Take Profit Order ("Custom Order").
☀ Dual Exit Strategy: We incorporated two distinct methods of exiting a trade. The first uses our custom signals, while the second triggers exit at a certain percentage of gain.
☀ Multiple Take Profit Orders: You have the flexibility to establish up to four different sell orders. This feature enables you to fractionate your exit strategy according to your needs. You can choose to trigger these fractions based on our custom signals or determine your own exit points by setting targeted gains at a fixed percentage.
☀ Confirmation Candle System: This feature enhances trade precision by requiring confirmation candles after a buy or sell signal. This confirmation, dependent on the next candle's closing price, helps reduce false signals and improves entry and exit points. While our confirmation system is applicable to all custom buy signals, it's solely dedicated for the bearish reversal when it comes to sell signals.
☀ Universal Compatibility: Easy Trade Pro's Strategy Tester works perfectly with any asset class. The code can handle different contract types, including the SPX contracts and fractional assets like Bitcoin. It's optimized to ensure proper execution of trades without rounding issues.
☀ Bullish and Bearish Reversal candles: Our method of detecting these pivotal candles combines conditions from buy and sell signals with pertinent divergences in Price, RSI, and Volume (OBV). The distinguishing factor, however, lies in recognizing significant shifts in market structure and liquidity grabs. To further enhance the credibility of our indicator, we've incorporated Bollinger Bands, serving as an additional layer in spotting potential trend reversals, particularly when aligned with long-wick candlesticks, engulfing patterns, and morning or evening star formations.
☀ Non-Repainting Indicator: Our indicator signals are designed not to repaint. Once a signal appears, it stays fixed, offering a reliable tool for your trading decisions.
================================================== EXTENSIVE TECHNICAL DESCRIPTION ====================================================
Easy Trade Pro is versatile, allowing you to analyze market trends across any financial asset. With its rigorous testing, our tool can be used confidently on any timeframe, from 1D to 1min, whether you prefer longer-term or shorter-term trades.
Although we recommend trading on timeframes between 1D and 1min, higher timeframes like 1W chart, can also provide broader insights.
Our study combines a variety of popular technical indicators, such as RSI, Stochastic RSI, MACD, DMI, Bollinger Bands as well as relevant EMAs. On the volume side OBV and MFI. Using a data-driven approach, “Easy Trade Pro” analyzes historical market trends to identify optimal ways to combine these indicators with significant divergences between price and oscillators. On top of that the code considers relevant changes in market structure and liquidity grabs, to generate reliable and accurate signals for potential buy and sell opportunities.
* ☎ --> Please not that MACD, BBs, and EMAs account for a minimal part of our script <--- ☎, If you're looking for a simpler tool, consider checking out our open-source indicator, 'RSI, SRSI, MACD, and DMI cross - Open source code'. You can find it here:
With our customizable system, traders will be able to identify:
1) Three types of buy signals🐂,💰,💎 and sell signals 🐻,🔨,💀
2) Bullish and bearish reversal candles with support and resistance lines
3) Bull and bear momentum signals
4) A function that utilizes Color bars to identify the strength of the trend
5) Three customizable moving averages
6) Alerts direct to your email or phone
7) Advanced and customizable settings menu
8) Our software also includes a backtesting system that that allows users to test their trading strategies on historical data, to check how they would have performed in real-world market conditions. This can help refine a trading strategy and make more informed decisions.
------------------------------------------------------------------------------ 1) BUY AND SELL SIGNALS ---------------------------------------------------------------------------------
Our buy and sell signals are generated using a custom combination of RSI, MFI, and Stochastic RSI levels, as well as relevant MACD and Stochastic RSI crosses. These indicators are carefully analyzed to identify potential trading opportunities and determine optimal entry and exit points for trades.
RSI (Relative strength index) measures the strength of a security's price action, while the SRSI (Stochastic Relative Strength Index) is a momentum oscillator that measures the current price relative to its high and low range over a set period. The Money Flow Index (MFI) is another momentum indicator that uses both price and volume data to measure buying and selling pressure. MACD (Moving Average Convergence Divergence) is a popular technical indicator used in financial markets to analyze price trends and momentum.
▶ With our system, you'll be able to identify three different levels of buy signals:
◉ The first level of buy signal is represented by a 🐂 emoji and is a "Good Buy". This signal indicates a possible buying opportunity. It indicates that could be a good opportunity to enter in a long trade. It's important to note that, the "Good Buy" signal can sometimes be supplemented with a green "Bull" text and a flag plotshape positioned beneath the signal. In these scenarios, we categorize this as a "Good Buy Bull" signal.
◉ The second level of buy signal is represented by a 💰 emoji and is a "Great Buy". This signal indicates a stronger buying opportunity than the "Good Buy" signal.
◉ The third and strongest buy signal is represented by a 💎 emoji and is an "Incredible Buy". This signal indicates a stronger buying opportunity than the "Good Buy" and "Great Buy" signals
▶ With our system, you'll be able to identify three different levels of sell signals:
◉ On the sell side, the first level is represented by a 🐻 emoji and is a "Good Sell". This signal indicates a possible selling opportunity. It indicates that could be a good opportunity to exit a trade or open a short position. It's important to note that, the "Good Sell" signal can occasionally be accompanied by a red "Bear" text and a flag plotshape positioned beneath the signal. In such instances, we refer to this as a "Good Sell Bear" signal.
◉ The second sell signal is represented by a 🔨 emoji and is a "Great Sell". This signal indicates a stronger selling opportunity than the "Good Sell" signal.
◉ The third and strongest sell signal is represented by a 💀 emoji and is an "Incredible Sell". This signal indicates a stronger selling opportunity than the "Good Sell" and "Great Sell" signals.
------------------------------------------2) "BULLISH AND BEARISH REVERSAL CANDLES PLUS SUPPORT AND RESISTANCE LINES" ------------------------------------------------
Bullish and bearish reversal candles are specific candles that have more probability to reverse the trend.
Our trading indicator is designed to identify bullish and bearish reversal candles. Our method of detecting these pivotal candles combines conditions from buy and sell signals with pertinent divergences in Price, RSI, and Volume (OBV). The distinguishing factor, however, lies in recognizing significant shifts in market structure and liquidity grabs. To further enhance the credibility of our indicator, we've incorporated Bollinger Bands, serving as an additional layer in spotting potential trend reversals, particularly when aligned with long-wick candlesticks, engulfing patterns, and morning or evening star formations.
These candles are represented by blue and orange colors respectively by default. Additionally, the indicator also uses lines that are drawn at either the opening or closing of candles to help identify pivot points of support or resistance. These candles, lines color or shape are customizable in the settings menu.
How can I benefit the most from bullish reversal candles? To make the most of bullish reversal candles, a powerful strategy is:
E.g, 1D chart - Wait for the next 1 or 2 candles to close above the support line linked to the bullish reversal candle. For lower timeframes, it is recommended to wait for 2 or 3 candles before making a trading decision. A good tip is also to look for other signals (confluence), like a buy signal. Traders should decide based on their risk tolerance.
Here below we can see an example of a bullish reversal candle in the BTC/USDT, 1D, chart. The system identify a bullish reversal candle (blue color), the next 2 candles are green and closed above the support blue line, in addition we have other bullish signals (confluence).
How can I benefit the most from bullish reversal lines? Bullish reversal lines can help traders to identify key level of support and maintain control of their position until a clear break below occurs.
In the example below we se how the price retrace to the support line:
After touching the price bounce up.
How can I benefit the most from bearish reversal candles? To make the most of bearish reversal candles, a powerful strategy is:
E.g, 1D chart - Wait for the next 1 or 2 candles to close below the resistance line linked to the bearish reversal candle. For lower timeframes, it is recommended to wait for 2 or 3 candles before making a trading decision. Traders should decide based on their risk tolerance.
Here below we can see an example of a bearish reversal candle in the ETH/USDT, 1D, chart. The system identify a bearish reversal candle (orange color), the next candle is red and closes below the resistance orange line. A good tip is also to look for other signals (confluence), like a sell signal.
How can I benefit the most from bearish reversal lines? Bearish reversal lines can help traders to identify key level of resistance and maintain control of their position until a clear break above occurs.
In the example below we se how the price bounce back to the resistance line and get rejected.
------------------------------------------------------------------------- 3) BULL AND BEAR MOMENTUM SIGNALS -----------------------------------------------------------------------
We analyzed factors such as buy or sell signals, long or short confirmation signals, DMI crossup or crossdown and breaks of market structure (BOS) or change of character (CHoCh) to determine the strength and direction of the trend. These study give us bull trend or bear trend signals that can help traders identify potential trading opportunities and make informed decisions.
These conditions are represented by a green word "BULL" and a flag shape below (bull momentum) and by a red word "BEAR" and a flag shape above (bear momentum) respectively by default. These plots shapes are customizable in the settings menu.
How can I benefit the most from bull momentum signals? To make the most of bull momentum signals, a powerful strategy is:
E.g, 1D chart - Look for confluence. If bull signal comes with a "Good Buy 🐂" in the same candle the signal is more strong. Another good combo is to look for a bullish reversal candle prior or after this signal, usually within a range of 1/2 candles. For lower timeframes, it is recommended to wait 2/3 candles before making a trading decision.
In the picture below we can see an example of a bull momentum signal in the US500, 1D, chart.
How can I benefit the most from bear momentum signals? To make the most of bear momentum signals, a powerful strategy is:
E.g, 1D chart - Look for confluence. If bear signal comes with a "Good Sell 🐻" in the same candle the signal is more strong. Another good combo is to look for a bearish reversal candle prior or after this signal, usually within a range of 1/2 candles. For lower timeframes, it is recommended to wait 2/3 candles before making a trading decision.
In the picture below we can see an example of a bear momentum signal in combo with a sell signal, NETFLIX, 1D, chart.
-------------------------------------------------------------- 4) "COLOR BARS THAT INDICATE THE STRENGTH OF THE TREND -----------------------------------------------------
This code is responsible for changing the color of the bars on a chart based on certain conditions. The gradient colors are defined for green and red, and the algorithm checks if the current bar is within a certain range of either a bearish reversal or bullish reversal candle and whether the price is above or below certain exponential moving averages or if important break of market structure occurs.
Ultimately, this feature helps traders visually identify potential trends and market shifts and avoid getting distracted by price fluctuations. Please note that every gradient of color can be customize by the user. We set 3 different bullish colors and 3 different bearish colors.
Below the picture of the settings menu related to the bar color.
----------------------------------------------------------------------5)THREE CUSTOMIZABLE MOVING AVERAGES ----------------------------------------------------------------------
You can choose up to three moving averages, any length and any type like SMA, EMA, WMA, HMA, RMA, SWMA and VWMA. Furthermore, you have the freedom to adjust the color and width of the lines to your preference.
Below the picture of the settings menu related to the moving averages.
----------------------------------------------------------------------6) ALERTS DIRECT TO YOUR EMAIL OR PHONE --------------------------------------------------------------------
Our alert feature sends real-time notifications directly to your email or phone when a signal is generated, allowing you to take immediate action and stay ahead of the market.
With our system, you first establish your own rules for trading in the strategy tester - this includes your criteria for entering and exiting trades.
Once you've defined these conditions, our system will start sending you alerts. These alerts will be triggered whenever your specified conditions are met. So, if the market matches your 'enter trade' conditions, you'll receive an alert prompting. Similarly, when your 'exit trade' conditions are met, you'll receive another alert.
Remember, these alerts are purely based on the conditions you set.
Once the condition is met, you will receive alerts directly to your email or phone when enter and exit a trade based on your custom conditions. To make sure you receive these notifications click on notifications tab.
---------------------------------------------------------------7) ADVANCED AND CUSTOMIZABLE SETTINGS MENU----------------------------------------------------------------------
We designed Easy Trade indicators with traders in mind, so it's user-friendly, easy to navigate and users can customize inputs, style, and colors of every feature in the indicator's settings menu.
-----------------------------------------------------------------------8) EASY TRADE PRO - BACKTESTING SYSTEM----------------------------------------------------------------------
Easy Trade Pro features a highly effective and realistic backtesting system, designed to mirror as closely as possible the real-world scenarios of entering and exiting trades.
Step 1:
Open the settings menu of the Indicator.
Once opened the settings menu click on properties.
Decide on the capital you wish to invest. Choose whether to use contracts or USD and determine the size of your orders. For the sake of realism, we recommend not exceeding 25% of your capital per order. However, if you decide to utilize your entire capital, make sure to adjust your stop loss accordingly. For instance, if you have a capital of 10K and use 10K with a stop loss at 2%, your potential loss would be $200. Conversely, if you use only 2K of your 10K capital with a stop loss at 10%, you would still lose the same 2% of your capital. To make your simulation even more authentic, consider incorporating broker fees or commissions into your calculations. For example, spot market fees are typically around 0.10%. If you're backtesting markets with low liquidity, consider factoring in slippage as well.
Step 2:
Navigate to the 'Inputs' section and scroll down until you come across 'Backtesting System - Strategy Test'. Once you locate this, click on the box and activate the 'USE STRATEGY SYSTEM' option by checking the tick box.
Also You will then need to set a 'Start Date' and 'End Date', establishing a specific time period during which you wish to test your strategy.
Otherwise you can consider to use the deep backtesting feature.
Step 3:
It's now time to establish the conditions for entering a trade. You can choose from five different types of custom buy signals: Good Buy, Good Buy Bull, Great Buy, Incredible Buy, and Bullish Reversal. Note that 'Great Buy' and 'Incredible Buy' are rare signals, so we advise against using them frequently in mechanical strategy tests; instead, consider them more for manual live tests. For more consistent results, we recommend using the other buy signals.
After determining your preferred buy signal, you can choose how many confirmation candles you wish to wait for before entering a trade. A 'confirmation' means that if the next candle closes above the opening or closing price of the chosen buy signal, it's considered a confirmation. This could be the opening or closing price, depending on whether the candle is green (close > open) or red.
You can set the number of confirmation candles in different time frames: below 2h, between 2h and 10h, and above 10h.
Step 4:
It's now time to safeguard your trade by managing risk. You can choose to implement a stop loss, expressed in percentage terms, or opt for a trailing stop. A trailing stop is a type of stop loss order that moves with the market price. It is designed to protect gains by enabling a trade to remain open and continue to profit as long as the market price is moving in a favorable direction. However, the trade closes if the market price changes direction by a specified amount (the 'trailing stop distance').
Additionally, you can minimize losses and move the stop loss to your entry point once the price reaches a certain percentage of profit. This strategy can help secure potential gains while limiting the potential for losses.
Step 5:
Now it's time to set the conditions for exiting the trade. You have the option to divide your exit into a maximum of four parts, with each part representing 25% of the position size. For each take profit point, you can choose from three different custom sell signals: Good Sell, Good Sell Bear, and Bearish Reversal.
Similarly, the concept of confirmation candles also applies here, but in this case, the candles are not closing above. A 'confirmation' for a sell signal means that if the next candle closes below the opening or closing price of the selected sell signal, it's considered a confirmation. This could be the opening or closing price, depending on whether the candle is green (open > close) or red (close < open).
So, when you're looking to sell, a confirmation would occur if the next candlestick's closing price is lower than the opening or closing price of the candlestick that triggered the sell signal. This indicates a potential bearish trend, providing the confirmation to execute the sell order.
Additionally, we've introduced a feature that allows you to move your stop loss to the entry point whenever the first take profit (1TP) is reached, which equates to hitting one custom sell signal.
Step 6:
We've also designed an alternative method for taking profits. With this approach, you can choose to exit your position once a fixed percentage gain from the entry point is reached. For instance, you might decide to exit when a 10% profit is achieved. Similarly to the previous method, this approach allows you to choose up to four exit points and determine the proportion of your position you want to close at each stage.
Conclusion:
Easy Trade Pro provides users with various options for entering and exiting trades. To effectively utilize the indicator, we strongly recommend conducting thorough backtesting and considering the results across your preferred trading pairs. It is advisable to analyze a substantial number of trades, ideally exceeding 100 trades, to obtain reliable insights into the indicator's performance. This approach will help you gain a better understanding of how Easy Trade Pro aligns with your trading strategy and objectives.
❗Keep attention❗
It is important to note that no trading indicator or strategy is foolproof, and there is always a risk of losses in trading. While this indicator may provide useful information for making conclusions, it should not be used as the sole basis for making trading decisions. Traders should always use proper risk management techniques and consider multiple factors when making trading decisions.
It is also important to be aware of the limitations of simulated performance results. Hypothetical or simulated results do not represent actual trading, and since trades have not been executed, results may be over- or under-compensated for market factors such as lack of liquidity. Simulated trading programs are also designed with the benefit of hindsight, and no representation is being made that any account will achieve profits or losses similar to those shown. Therefore, our indicators are for informative purposes only and not intended to be used as financial advice.
We encourage traders to use our indicators as part of a well-rounded trading strategy and to always be aware of the risks involved in trading. Remember that past performance is not indicative of future results and always trade responsibly.

ZenThe Theory of Entanglement (缠论) is one of the most widely studied trading theories in China, but it is much less known among traders outside. Its philosophy is based on human greed, hatred, delusion, arrogance and doubt, which reveal the most fundamental aspect of the market. Fractals, strokes, line segments and pivots are basic elements in the Theory of Entanglement. However, manually drawing them on an ever-changing chart is both challenging and time consuming, and may lead to incorrect interpretation of the market trend. This indicator aims to automate the process of drawing strokes, line segments, and pivots for three consecutive levels such as 1m, 5m, and 30m (similar to time frames). The operation is then based on the so-called “same-level decomposition” technique. Buying and selling points are automatically marked on the chart, as well as points where trend divergence and range divergence occurred, which often signals a trend reversal.
Relations between fractal, stroke, line segment, pivot, and some important definitions:
• Stroke: Connecting two adjacent top and bottom fractals with at least one candlestick in between.
• Line segment: Consists of an odd number of strokes, at least three strokes are required, and the first three strokes must have overlapping parts.
• Level: Levels generally correspond to time frames of the chart, such as 1w, 1d, 4h, 30m, 5m, 1m etc. Sub-level: The above levels are respectively the sub-levels of the previous level.
• Pivot: The part of a trend type at a certain level that is overlapped by at least three consecutive sub-level trend types.
• Trend type: There are two trend types: trend and range. In trend, there are also two types: rising trend and falling trend.
• Range: At any level, a completed trend type contains only one pivot.
• Trend: At any level, a completed trend type contains at least two pivots in the same direction in sequence, which is called a trend at this level.
List of drawings on the chart:
1. Thin black lines: Strokes at the current level.
2. Thick blue lines: Strokes at a higher level, also line segments at the current level.
3. Purple dotted lines: Line segments at a higher level, also strokes at two levels higher from the current one.
4. Blue shaded rectangles: Pivots at the sub-level in a rising trend or range.
5. Red shaded rectangles: Pivots at the sub-level in a falling trend or range.
6. Green shaded rectangles: Pivots at the current level in a rising trend or range.
7. Orange shaded rectangles: Pivots at the current level in a falling trend or range.
List of symbols and labels on the chart (above the candle: sell signal, below the candle: buy signal)
1. Purple triangles below the candle: double golden cross of Stochastic and MACD, buy signal
2. Purple triangles above the candle: double death cross of Stochastic and MACD, sell signal
3. Blue triangles below the candle: EMA5 crosses EMA13 up, buy signal
4. Red triangles above the candle: EMA5 crosses EMA13 down, sell signal
5. Green triangles below the candle: EMA5 crosses EMA55 up, buy signal
6. Orange triangles above the candle: EMA5 crosses EMA55 down, sell signal
7. Blue circles on the low point of the candle: bottom divergence occurred, buy signal
8. Red circles on the high point of the candle: top divergence occurred, sell signal
9. Blue "R" label below the candle: bottom divergence calculated from RSI occurred, buy signal
10. Red "R" label above the candle: top divergence calculated from RSI occurred, sell signal
11. Blue "M" label below the candle: bottom divergence calculated from MACD occurred, buy signal
12. Red "M" label above the candle: top divergence calculated from MACD occurred, sell signal
13. Blue "RM" label below the candle: bottom divergence calculated from both RSI and MACD occurred, buy signal
14. Red "RM" label above the candle: top divergence calculated from both RSI and MACD occurred, sell signal
15. Blue "1(R)", "1(M)", "1(RM)" labels below the candle: 1st buying point due to bottom trend divergence or range divergence calculated from RSI, MACD, and both RSI and MACD occurred, respectively, buy signal
16. Red "1(R)", "1(M)", "1(RM)" labels above the candle: 1st selling point due to top trend divergence or range divergence calculated from RSI, MACD, and both RSI and MACD occurred, respectively, sell signal
17. Blue "3" label below the candle: 3rd buying point, buy signal
18. Red "3" label above the candle: 3rd selling point, sell signal
19. Green "3" label below the candle: 3rd buying point of a higher-level pivot, buy signal
20. Orange "3" label above the candle: 3rd selling point of a higher-level pivot, sell signal
21. Yellow-shaded vertical areas: candles where volume spikes occurred
22. Short red horizontal lines: highest point of volume spikes, potential support or resistance
23. Short blue horizontal lines: lowest point of volume spikes, potential support or resistance
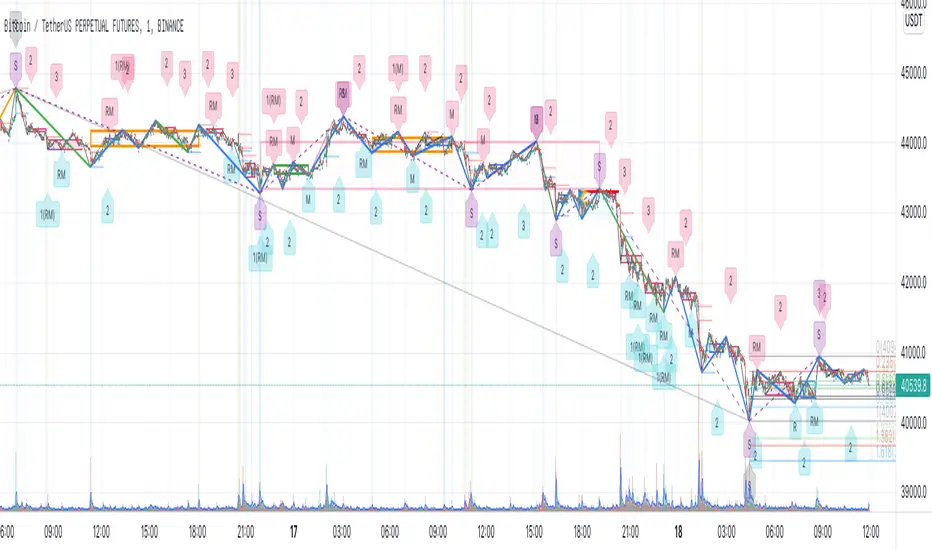
[SignalFI] MACD+RSI+MA Trend [V1.0]Welcome,
Proud to release a trending analysis tool for looking at the popular strategy of RSI + MACD + 12/26 EMA moving averages. The script is a unified trend script that shows:
- 12/26 EMA Trend
- MACD Crossovers
- MACD Histogram Pivots
- RSI Overbought (RSI > 70 = White Candles)
- RSI Oversold (RSI < 30 = Deep Blue Candles)
- RSI Pivots
Collectively, this allows you to implement and alert on one of the most popular and widely use strategies, all from one script.
In addition, we've added a third EMA moving average (Default 9 Candle EMA) that represents the MACD signal line on the chart. This line will change color to denote whether the MACD signal line is rising or falling compared to the previous candle (represented by the 'circles trend line' on the graph).
Script is fully alerted:
1) Bull MACD X
2) Bear MACD X
3) MACD Histo Pivot (Bull/Bear)
4) RSI Pivot (Bull/Bear)
5) Signal Line X (Bull/Bear)
Enjoy!
SignalFI was created to help traders and investors to effectively analyze the market based on the Golden Mean Ratio (Fibonacci numbers), plan a trade and ultimately execute it. To help inform and educate market decisions we developed a set of Trading Indicators which are available on TradingView , the most advanced and yet easy to use charting platform available on the web.
SignalFI indicators are just that, indicators. Our indicators are generally configured to use completely historical data (negating repaint), and we advise all alerts created with SignalFI indicators to be fired upon "close" of the current candle. Our indicators can provide valuable context and visualization support when performing market analysis and executing buy and sell decisions. However. we are not financial experts, and all information presented on this site or our other media outlets are for educational purposes only.
For subscription information, visit www.signalfi.net and follow us on twitter .

Bottom Reversal Radar — Berk v1.4Bottom Reversal Radar — Berk v1.4
What it does:
Combines RSI recovery after oversold, MACD bull cross, close above EMA8, near-EMA200 proximity, volume expansion, and simple bullish divergence (pivot lows) into a single score.
Signal: Trigger when Score ≥ Threshold (default 3). Set alert via Create Alert → “Dipten Dönüş — Ana Sinyal” → Once per bar close.
How it works
RSI recovery: After touching oversold (30), RSI crosses up 35 within last X bars.
MACD bull cross: MACD Line crosses above Signal.
Close above EMA8 and BOS (close above recent swing high) confirm momentum.
Near EMA200: Price within −5%…+2% band adds a point.
Volume spike: Volume ≥ 1.5× SMA(20) adds a point.
Bullish divergence: Lower price low + higher RSI low (pivot 3/3) adds a point.
Inputs
RSI(14), rsiOS=30, rsiRecover=35, Volume SMA(20) with 1.5× multiplier, EMA200 proximity band −5%…+2%, lookbackBars=5, Score threshold default 3.
Usage tips
Best on Daily / 4H. If too many false positives: raise threshold to 4 and volume to 1.8–2.0×.
Pair with Screener filters: RSI≥35, MACD Line>Signal, Price above EMA8, Volume/Avg(20)≥1.5, and near EMA200 (%).
Disclaimer
For educational purposes only. Not financial advice.
Release notes (v1.4)
Fixed bullDiv typo; simplified visuals; Pine v5.
Tags: rsi, macd, ema, volume, divergence, reversal, trend, screener, bist, stocks, crypto
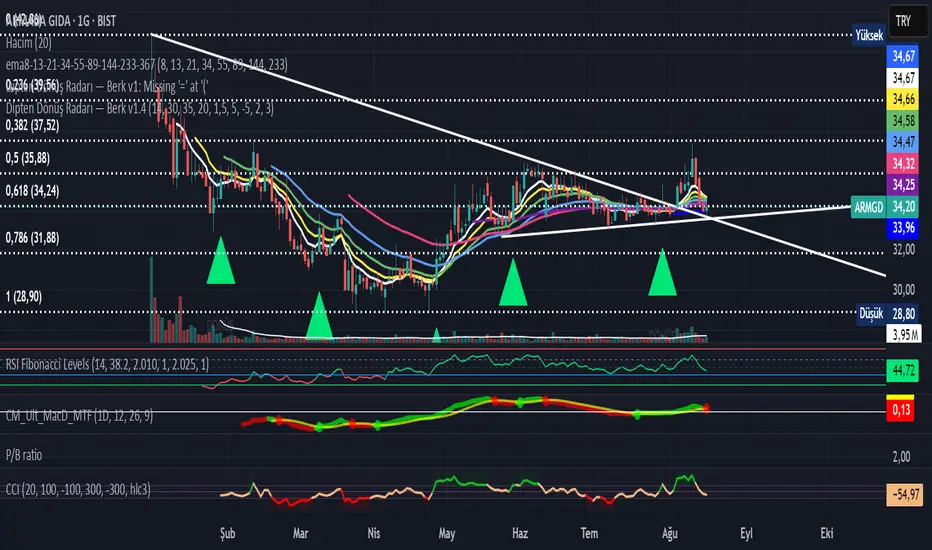
SMT Oscillator: Smarter Money Divergence Detector [PhenLabs]📊Phenlabs - SMT Oscillator: Smarter Money Divergence Detector
Version: PineScript™v6
📌Description
The SMT Oscillator is a sophisticated tool designed to identify smart money divergence between two correlated assets. By analyzing the momentum and volume-weighted price action of a primary and secondary symbol, traders can spot subtle shifts in market dynamics that often precede significant price movements. This indicator is built to provide a clearer, more filtered view of inter-market relationships, solving the common problem of false signals and market noise. Its primary purpose is to equip traders with a quantifiable edge in detecting potential reversals or continuations that are not obvious on a standard price chart.
🚀Points of Innovation
Dual-Symbol Divergence Core: Directly compares momentum (RSI or MACD) between two user-selected symbols to pinpoint true SMT divergence.
Volume-Weighted Analysis: Integrates volume delta into the divergence calculation, giving more weight to moves backed by significant market participation.
Entropy Filter for Noise Reduction: Employs an entropy calculation to filter out low-quality signals during choppy or consolidating market conditions.
Predictive Forecast Line: Utilizes a linear regression model to project the oscillator’s future trajectory, offering a forward-looking glimpse of potential momentum shifts.
Customizable Signal Sensitivity: Allows fine-tuning of overbought and oversold levels to adapt to different market volatilities and trading styles.
Integrated Signal Alerts: Provides built-in alerts for bullish/bearish zero crosses and overbought/oversold conditions.
🔧Core Components
Momentum Engine: The user can select either RSI or MACD as the underlying engine for the divergence calculation, allowing for flexibility in analysis.
Normalization Function: Price data from both symbols is normalized using percentage change to ensure a true “apples-to-apples” comparison, regardless of their nominal price differences.
Divergence Calculator: The core algorithm that subtracts the secondary symbol’s momentum from the primary’s and normalizes the result using the combined standard deviation.
Smoothing Mechanism: An Exponential Moving Average (EMA) is applied to the raw oscillator output to reduce choppiness and provide a clearer signal line.
🔥Key Features
Multi-Asset Comparison: Go beyond single-asset analysis by comparing correlated pairs like ES/NQ or BTC/ETH to uncover hidden trading opportunities.
Heatmap Visualization: An optional heatmap mode provides an intuitive visual representation of divergence strength, making it easier to gauge market sentiment at a glance.
Configurable Lookback and Timeframe: Adjust the lookback period and analysis timeframe to suit your specific strategy, from short-term scalping to long-term trend analysis.
Signal Markers: Visual markers are plotted directly on the chart for bullish and bearish zero-line crossovers, providing clear entry and exit signals.
🎨Visualization
SMT Oscillator Line: The primary visual element, colored blue for bullish (positive) divergence and orange for bearish (negative) divergence.
Zero Line: A solid horizontal line at the zero level, indicating the equilibrium point between the two assets. Crossovers of this line signal a shift in relative strength.
Overbought/Oversold Zones: Dotted lines at the +80 and -80 levels (customizable) that highlight extreme divergence readings, often indicating potential exhaustion points.
Forecast Line: A predictive line that plots the anticipated path of the oscillator, giving traders an advanced warning of potential changes in momentum.
📖Usage Guidelines
Setting Categories
Primary Symbol
Default: (Chart Symbol)
Description: The main asset you are analyzing. Leave blank to use the symbol currently on your chart.
Secondary Symbol
Default: CME_MINI:ES1! (used with NASDAQ futures due to inherent heavy correlation
Description: The asset to compare against the primary symbol.
Lookback Period
Default: 14
Range: 8-100
Description: Controls the calculation window for momentum (RSI/MACD). Higher values result in a smoother, less sensitive oscillator.
Divergence Type
Default: RSI
Options: RSI, MACD
Description: Choose the momentum indicator to use for the divergence calculation.
Enable Volume Weighting
Default: true
Description: When enabled, gives more weight to divergence signals that are accompanied by significant volume.
✅Best Use Cases
Identifying high-probability reversal points by spotting divergence in overbought or oversold territory.
Confirming the strength of a trend by observing sustained positive or negative divergence.
Pairs trading by taking a long position on the outperforming asset and a short position on the underperforming one during a divergence.
Risk management by recognizing when a current trend is losing its underlying momentum.
⚠️Limitations
Requires Correlated Assets: The indicator’s effectiveness is highly dependent on the selection of two assets with a known correlation (e.g., ES and NQ).
Not a Standalone System: Divergence signals should be used in conjunction with other forms of analysis (price action, market structure) and not as a complete trading system.
Lagging by Nature: As it is based on moving averages and past price data, the oscillator is inherently lagging and may not capture all rapid price changes.
💡What Makes This Unique
Combined Momentum & Volume: Unlike standard oscillators, it fuses momentum with volume delta for a more robust “Smart Money” perspective.
Noise-Filtering Mechanism: The proprietary entropy filter is a unique feature designed to weed out insignificant market chatter and focus on high-conviction signals.
🔬How It Works
Data Normalization:
The script first normalizes the price data of the two selected symbols into percentage changes. This ensures that the comparison is fair, regardless of the difference in their price scales.
Momentum Calculation:
It then calculates the chosen momentum value (either RSI or MACD histogram) for each of the normalized price series.
Divergence Computation:
The core of the indicator lies in subtracting the momentum of the secondary symbol from the primary one. This raw divergence is then optionally weighted by volume and filtered for market noise (entropy) to produce the final oscillator value.
💡Note:
For best results, use this indicator on adequate timeframes to filter out market noise. Always confirm signals with price action analysis before entering a trade.

MTF Dashboard 9 Timeframes + Signals# MTF Dashboard Pro - Multi-Timeframe Confluence Analysis System
## WHAT THIS SCRIPT DOES
This script creates a comprehensive dashboard that simultaneously analyzes market conditions across 9 different timeframes (1m, 5m, 15m, 30m, 1H, 4H, Daily, Weekly, Monthly) using a proprietary confluence scoring methodology. Unlike simple multi-timeframe displays that show individual indicators separately, this script combines trend analysis, momentum, volatility signals, and volume analysis into unified confluence scores for each timeframe.
## WHY THIS COMBINATION IS ORIGINAL AND USEFUL
**The Problem Solved:** Most traders manually check multiple timeframes and struggle to quickly assess overall market bias when different timeframes show conflicting signals. Existing MTF scripts typically display individual indicators without synthesizing them into actionable intelligence.
**The Solution:** This script implements a mathematical confluence algorithm that:
- Weights each indicator's signal strength (trend direction, RSI momentum, MACD volatility, volume analysis)
- Calculates normalized scores across all active timeframes
- Determines overall market bias with statistical confidence levels
- Provides instant visual feedback through color-coded symbols and star ratings
**Unique Features:**
1. **Confluence Scoring Algorithm**: Mathematically combines multiple indicator signals into a single confidence rating per timeframe
2. **Market Bias Engine**: Automatically calculates overall directional bias with percentage strength across all selected timeframes
3. **Dynamic Display System**: Real-time updates with customizable layouts, color schemes, and selective timeframe activation
4. **Statistical Analysis**: Provides bullish/bearish vote counts and overall confluence percentages
## HOW THE SCRIPT WORKS TECHNICALLY
### Core Calculation Methodology:
**1. Trend Analysis (EMA-based):**
- Fast EMA (default: 9) vs Slow EMA (default: 21) crossover analysis
- Returns values: +1 (bullish), -1 (bearish), 0 (neutral)
**2. Momentum Analysis (RSI-based):**
- RSI levels: >70 (strong bullish +2), >50 (bullish +1), <30 (strong bearish -2), <50 (bearish -1)
- Provides overbought/oversold context for trend confirmation
**3. Volatility Analysis (MACD-based):**
- MACD line vs Signal line positioning
- Histogram strength comparison with previous bar
- Combined score considering both direction and momentum strength
**4. Volume Analysis:**
- Current volume vs 20-period moving average
- Thresholds: >150% MA (strong +2), >100% MA (bullish +1), <50% MA (weak -2)
**5. Confluence Calculation:**
```
Confluence Score = (Trend + RSI + MACD + Volume) / 4.0
```
**6. Market Bias Determination:**
- Counts bullish vs bearish signals across all active timeframes
- Calculates bias strength percentage: |Bullish Count - Bearish Count| / Total Active TFs * 100
- Determines overall market direction: BULLISH, BEARISH, or NEUTRAL
### Multi-Timeframe Implementation:
Uses `request.security()` calls to fetch data from each timeframe, ensuring all calculations are performed on the respective timeframe's data rather than current chart timeframe, providing accurate multi-timeframe analysis.
## HOW TO USE THIS SCRIPT
### Initial Setup:
1. **Timeframe Selection**: Enable/disable specific timeframes in "Timeframe Selection" group based on your trading style
2. **Indicator Configuration**: Adjust EMA periods (Fast: 9, Slow: 21), RSI length (14), and MACD settings (12/26/9) to match your analysis preferences
3. **Display Options**: Choose table position, text size, and color scheme for optimal visibility
### Reading the Dashboard:
**Symbol Interpretation:**
- ⬆⬆ = Strong bullish signal (score ≥ 2)
- ⬆ = Bullish signal (score > 0)
- ➡ = Neutral signal (score = 0)
- ⬇ = Bearish signal (score < 0)
- ⬇⬇ = Strong bearish signal (score ≤ -2)
**Confluence Stars:**
- ★★★★★ = Very high confidence (score > 0.75)
- ★★★★☆ = High confidence (score > 0.5)
- ★★★☆☆ = Medium confidence (score > 0.25)
- ★★☆☆☆ = Low confidence (score > 0)
- ★☆☆☆☆ = Very low confidence (score > -0.25)
**Market Bias Section:**
- Shows overall market direction across all active timeframes
- Strength percentage indicates conviction level
- Overall confluence score represents average agreement across timeframes
### Trading Applications:
**Entry Signals:**
- Look for high confluence (4-5 stars) across multiple timeframes in same direction
- Higher timeframe alignment provides stronger signal validation
- Use confluence percentage >75% for high-probability setups
**Risk Management:**
- Lower timeframe conflicts may indicate choppy conditions
- Neutral bias suggests ranging market - adjust position sizing
- Strong bias with high confluence supports larger position sizes
**Timeframe Harmony:**
- Short-term trades: Focus on 1m-1H alignment
- Swing trades: Emphasize 1H-Daily alignment
- Position trades: Prioritize Daily-Monthly confluence
## SCRIPT SETTINGS EXPLANATION
### Dashboard Settings:
- **Table Position**: Choose optimal location (Top Right recommended for most layouts)
- **Text Size**: Adjust based on screen resolution and preferences
- **Color Scheme**: Professional (default), Classic, Vibrant, or Dark themes
- **Background Color/Transparency**: Customize table appearance
### Timeframe Selection:
All timeframes optional - activate based on trading timeframe preference:
- **Lower Timeframes (1m-30m)**: Scalping and day trading
- **Medium Timeframes (1H-4H)**: Swing trading
- **Higher Timeframes (D-M)**: Position trading and long-term bias
### Indicator Parameters:
- **Fast EMA (Default: 9)**: Shorter period for trend sensitivity
- **Slow EMA (Default: 21)**: Longer period for trend confirmation
- **RSI Length (Default: 14)**: Standard momentum calculation period
- **MACD Settings (12/26/9)**: Standard MACD configuration for volatility analysis
### Alert Configuration:
- **Strong Signals**: Alerts when confluence >75% with clear directional bias
- **High Confluence**: Alerts when multiple timeframes strongly agree
- All alerts use `alert.freq_once_per_bar` to prevent spam
## VISUAL FEATURES
### Chart Elements:
- **Background Coloring**: Subtle background tint reflects overall market bias
- **Signal Labels**: Strong buy/sell labels appear on chart during high-confluence signals
- **Clean Presentation**: Dashboard overlays chart without interfering with price action
### Color Coding:
- **Green/Bullish**: Various green shades for positive signals
- **Red/Bearish**: Various red shades for negative signals
- **Gray/Neutral**: Neutral color for conflicting or weak signals
- **Transparency**: Configurable transparency maintains chart readability
## IMPORTANT USAGE NOTES
**Realistic Expectations:**
- This tool provides analysis framework, not trading signals
- Always combine with proper risk management
- Past performance does not guarantee future results
- Market conditions can change rapidly - use appropriate position sizing
**Best Practices:**
- Verify signals with additional analysis methods
- Consider fundamental factors affecting the instrument
- Use appropriate timeframes for your trading style
- Regular parameter optimization may be beneficial for different market conditions
**Limitations:**
- Effectiveness may vary across different instruments and market conditions
- Confluence scoring is mathematical model - not predictive guarantee
- Requires understanding of underlying indicators for optimal use
This script serves as a comprehensive analysis tool for traders who need quick, organized access to multi-timeframe market information with statistical confidence levels.

OpenAI Signal Generator - Enhanced Accuracy# AI-Powered Trading Signal Generator Guide
## Overview
This is an advanced trading signal generator that combines multiple technical indicators using AI-enhanced logic to generate high-accuracy trading signals. The indicator uses a sophisticated combination of RSI, MACD, Bollinger Bands, EMAs, ADX, and volume analysis to provide reliable buy/sell signals with comprehensive market analysis.
## Key Features
### 1. Multi-Indicator Analysis
- **RSI (Relative Strength Index)**
- Length: 14 periods (default)
- Overbought: 70 (default)
- Oversold: 30 (default)
- Used for identifying overbought/oversold conditions
- **MACD (Moving Average Convergence Divergence)**
- Fast Length: 12 (default)
- Slow Length: 26 (default)
- Signal Length: 9 (default)
- Identifies trend direction and momentum
- **Bollinger Bands**
- Length: 20 periods (default)
- Multiplier: 2.0 (default)
- Measures volatility and potential reversal points
- **EMAs (Exponential Moving Averages)**
- Fast EMA: 9 periods (default)
- Slow EMA: 21 periods (default)
- Used for trend confirmation
- **ADX (Average Directional Index)**
- Length: 14 periods (default)
- Threshold: 25 (default)
- Measures trend strength
- **Volume Analysis**
- MA Length: 20 periods (default)
- Threshold: 1.5x average (default)
- Confirms signal strength
### 2. Advanced Features
- **Customizable Signal Frequency**
- Daily
- Weekly
- 4-Hour
- Hourly
- On Every Close
- **Enhanced Filtering**
- EMA crossover confirmation
- ADX trend strength filter
- Volume confirmation
- ATR-based volatility filter
- **Comprehensive Alert System**
- JSON-formatted alerts
- Detailed technical analysis
- Multiple timeframe analysis
- Customizable alert frequency
## How to Use
### 1. Initial Setup
1. Open TradingView and create a new chart
2. Select your preferred trading pair
3. Choose an appropriate timeframe
4. Apply the indicator to your chart
### 2. Configuration
#### Basic Settings
- **Signal Frequency**: Choose how often signals are generated
- Daily: Signals at the start of each day
- Weekly: Signals at the start of each week
- 4-Hour: Signals every 4 hours
- Hourly: Signals every hour
- On Every Close: Signals on every candle close
- **Enable Signals**: Toggle signal generation on/off
- **Include Volume**: Toggle volume analysis on/off
#### Technical Parameters
##### RSI Settings
- Adjust `rsi_length` (default: 14)
- Modify `rsi_overbought` (default: 70)
- Modify `rsi_oversold` (default: 30)
##### EMA Settings
- Fast EMA Length (default: 9)
- Slow EMA Length (default: 21)
##### MACD Settings
- Fast Length (default: 12)
- Slow Length (default: 26)
- Signal Length (default: 9)
##### Bollinger Bands
- Length (default: 20)
- Multiplier (default: 2.0)
##### Enhanced Filters
- ADX Length (default: 14)
- ADX Threshold (default: 25)
- Volume MA Length (default: 20)
- Volume Threshold (default: 1.5)
- ATR Length (default: 14)
- ATR Multiplier (default: 1.5)
### 3. Signal Interpretation
#### Buy Signal Requirements
1. RSI crosses above oversold level (30)
2. Price below lower Bollinger Band
3. MACD histogram increasing
4. Fast EMA above Slow EMA
5. ADX above threshold (25)
6. Volume above threshold (if enabled)
7. Market volatility check (if enabled)
#### Sell Signal Requirements
1. RSI crosses below overbought level (70)
2. Price above upper Bollinger Band
3. MACD histogram decreasing
4. Fast EMA below Slow EMA
5. ADX above threshold (25)
6. Volume above threshold (if enabled)
7. Market volatility check (if enabled)
### 4. Visual Indicators
#### Chart Elements
- **Moving Averages**
- SMA (Blue line)
- Fast EMA (Yellow line)
- Slow EMA (Purple line)
- **Bollinger Bands**
- Upper Band (Green line)
- Middle Band (Orange line)
- Lower Band (Green line)
- **Signal Markers**
- Buy Signals: Green triangles below bars
- Sell Signals: Red triangles above bars
- **Background Colors**
- Light green: Buy signal period
- Light red: Sell signal period
### 5. Alert System
#### Alert Types
1. **Signal Alerts**
- Generated when buy/sell conditions are met
- Includes comprehensive technical analysis
- JSON-formatted for easy integration
2. **Frequency-Based Alerts**
- Daily/Weekly/4-Hour/Hourly/Every Close
- Includes current market conditions
- Technical indicator values
#### Alert Message Format
```json
{
"symbol": "TICKER",
"side": "BUY/SELL/NONE",
"rsi": "value",
"macd": "value",
"signal": "value",
"adx": "value",
"bb_upper": "value",
"bb_middle": "value",
"bb_lower": "value",
"ema_fast": "value",
"ema_slow": "value",
"volume": "value",
"vol_ma": "value",
"atr": "value",
"leverage": 10,
"stop_loss_percent": 2,
"take_profit_percent": 5
}
```
## Best Practices
### 1. Signal Confirmation
- Wait for multiple confirmations
- Consider market conditions
- Check volume confirmation
- Verify trend strength with ADX
### 2. Risk Management
- Use appropriate position sizing
- Implement stop losses (default 2%)
- Set take profit levels (default 5%)
- Monitor market volatility
### 3. Optimization
- Adjust parameters based on:
- Trading pair volatility
- Market conditions
- Timeframe
- Trading style
### 4. Common Mistakes to Avoid
1. Trading without volume confirmation
2. Ignoring ADX trend strength
3. Trading against the trend
4. Not considering market volatility
5. Overtrading on weak signals
## Performance Monitoring
Regularly review:
1. Signal accuracy
2. Win rate
3. Average profit per trade
4. False signal frequency
5. Performance in different market conditions
## Disclaimer
This indicator is for educational purposes only. Past performance is not indicative of future results. Always use proper risk management and trade responsibly. Trading involves significant risk of loss and is not suitable for all investors.

Visually Layered OscillatorVisually Layered Oscillator User's Manual
Visually Layered Oscillator is a multi-oscillator designed to provide an intuitive visualization of RSI, MACD, ADX + DMI, allowing traders to interpret multiple signals at a glance.
It is designed to allow comparison within the same panel while maintaining the inherent meaning of each oscillator and compensating for visual distortion issues caused by size differences.
Component Overview
Item Description
RSI (x10) Displays relative buy/sell strength. Values above 70 are overbought; values below 30 are oversold.
MACD (3,16,10) Momentum indicator showing the difference between moving averages. Consists of lines and histograms
ADX ×50 + DMI Indicates the strength of the trend; ADX determines the strength of the trend and DMI determines whether it is buy/sell dominant.
White background color treatment Removes difficult-to-see grid lines to improve visibility.
🖥️ Screen Example
The panel is divided into the following three layers
mathematica
Copy
Edit
Top: ⬆️ RSI (purple)
Middle: 📈 MACD, Signal, Histogram + Color Fill
Bottom: 📉 ADX × 50, DMI+ / DMI- (Red, Blue, Orange)
TIP: If you zoom in on the indicators at a larger scale, you can see that each indicator is drawn at a different height level and placed in such a way that they do not overlap.
⚙️ Settings
Fast Length: MACD Quick Line Duration (Basic 3)
Slow Length: MACD slow line period (basic 16)
Smoothing: Signal line smoothing value (basic 10)
Notes and Tips
RSI × 10 and ADX × 50 are for visualization purposes only multiplied by multiples of the actual values. It does not affect the calculation and maintains the original RSI/ADX characteristics.
The MACD fill color visually highlights crossing conditions.
The background is treated in full white, making the indicator look clean without grid lines.

NeuroFlow Pro IndicatorThe **NeuroFlow Pro Indicator** is a comprehensive technical analysis tool designed for traders on the TradingView platform. It provides actionable buy and sell signals by combining multiple technical indicators, including Moving Averages, MACD, RSI, Stochastic RSI, SuperTrend, Ichimoku Cloud, Bollinger Bands, and Volume analysis. The indicator generates a **Composite Score** (0–100) that reflects market conditions, with low scores indicating bullish opportunities and high scores suggesting bearish conditions. It also identifies key trend reversal points and significant EMA crossovers (Golden Cross and Death Cross) to help traders make informed decisions.
**Key Features**:
- **Composite Score**: Aggregates signals from multiple indicators to provide a single, easy-to-read metric.
- **Buy/Sell Signals**: Generates clear signals for potential long (buy) and short (sell) opportunities.
- **Golden/Death Cross**: Marks EMA 50 crossing above (🚀) or below (💀) EMA 200, indicating major trend shifts.
- **Dashboard**: Displays real-time metrics like trend direction, momentum, volume, and signal confidence.
- **Customizable Alerts**: Notifies users of buy/sell signals, divergences, and EMA crossovers via TradingView’s alert system.
- **Multi-Timeframe Analysis**: Incorporates higher timeframe trends for enhanced signal reliability.
- **Candlestick Patterns**: Optionally includes patterns like Hammer, Engulfing, or Morning Star for signal confirmation.
This indicator is ideal for traders seeking a robust, all-in-one tool to identify trading opportunities across various markets (e.g., crypto, stocks, forex) and timeframes (e.g., 1H, 4H, daily).
User Guide for NeuroFlow Pro Indicator
Understanding the Indicator
- **Dashboard**:
- Located on the chart (left or right, configurable), it shows real-time metrics:
- **Comp Score**: Composite Score (0–100); low (<30) is bullish, high (>70) is bearish.
- **Trend**: Bullish, Bearish, or Neutral
- **MTF Trend**: Trend from a higher timeframe (e.g., 60m or 240m).
- **Momentum**: RSI and Stochastic RSI-based momentum (Bullish, Bearish, Neutral).
- **MFI**: Money Flow Index (Inflow, Outflow, Neutral).
- **Volatility**: High or Low based on ATR and Bollinger Bands.
- **Volume**: High, Low, or Neutral relative to volume MA.
- **Ichimoku**: Bullish, Bearish, or Neutral based on cloud position.
- **ADX Strength**: Strong or Weak trend based on ADX.
- **Divergence**: Bullish, Bearish, or Neutral for RSI/MACD divergences.
- **Reversal**: Bullish or Bearish reversal potential with confidence percentage.
- **Signal Status**: Long (buy), Short (sell), or None.
- **Signal Confid**: Confidence percentage for the current signal.
- **Chart Visuals**:
- **EMA 50 (White)**: Fast-moving average for short-term trends.
- **EMA 200 (Blue)**: Long-moving average for long-term trends.
- **Golden Cross (🚀)**: Green rocket emoji when EMA 50 crosses above EMA 200 (bullish).
- **Death Cross (💀)**: Red skull emoji when EMA 50 crosses below EMA 200 (bearish).
- **Alerts**:
- Configurable for Buy/Sell Signals, Golden/Death Cross, and Bullish/Bearish Divergences.
Configuring Settings
1. **Open Settings**:
- Right-click the indicator’s name on the chart and select “Settings,” or double-click the indicator in the chart’s indicator list.
2. **Key Settings to Customize**:
- **Strategy Settings**:
- **Max ATR Multiplier**: Adjusts sensitivity to volatility (default: 3.0).
- **Main Settings**:
- **Candlestick Pattern**: Choose Hammer, Engulfing, Morning Star, or Custom (default: Hammer).
- **Multi-Timeframe Period**: Set higher timeframe for trend analysis (e.g., 60m, 240m, Daily; default: 60m).
- **Higher Timeframe**: Secondary timeframe for confirmation (default: 240m).
- **Use Candlestick Patterns**: Enable/disable pattern-based signals (default: off).
- **Use Volume Filter**: Require high volume for signals (default: on).
- **Use ADX Filter**: Require strong trend for signals (default: on).
- **Momentum Settings**:
- **RSI/Stochastic/MFI Lengths**: Adjust periods for RSI, Stochastic RSI, and MFI (defaults: 14, 14, 60).
- **EMA Lengths**: Fast (50), Slow (100), Long (200) for trend and crossovers.
- **ATR/ADX Lengths**: Volatility and trend strength periods (default: 14).
- **SuperTrend/Bollinger/Ichimoku Settings**:
- Customize periods and multipliers (defaults: SuperTrend 10/3.0, Bollinger 20/2.0, Ichimoku 9/26/52).
- **MACD Settings**:
- **MACD Preset**: Auto (timeframe-based), 1H (3-10-16), 4H (5-34-21), D (5-15-9), or Custom (default: Auto).
- **Custom MACD Lengths**: Fast (12), Slow (26), Signal (9) for Custom preset.
- **Weights Settings**:
- Adjust weights for trend, momentum, volatility, etc., to prioritize certain indicators (defaults: Trend 1.0, Momentum 0.3, etc.).
- **Threshold Settings**:
- **Bullish/Bearish Reversal Thresholds**: Set score thresholds for reversals (default: 30/70).
- **ADX Threshold**: Minimum ADX for trend strength (default: 20).
- **Signal Thresholds**: Base (70) and alert (80) thresholds for signals.
- **Dashboard Settings**:
- **Position**: Left or Right (default: Right).
- **Show/Hide Metrics**: Enable/disable dashboard rows (e.g., Comp Score, Trend, MFI; all enabled by default except Volatility and Volume MA).
3. **Save Changes**:
- Click “OK” to apply settings. The dashboard and plots update instantly.
Using the Indicator
1. **Interpreting Signals**:
- **Buy Signal (Long)**: Appears when Composite Score is low (≤30), with at least two bullish confirmations . Shown as “Long” in Signal Status with confidence percentage.
- **Sell Signal (Short)**: Appears when Composite Score is high (≥70), with at least two bearish confirmations. Shown as “Short” in Signal Status.
- **Golden Cross (🚀)**: Indicates a bullish trend when EMA 50 crosses above EMA 200. Look for confirmation from Composite Score and Signal Status.
- **Death Cross (💀)**: Indicates a bearish trend when EMA 50 crosses below EMA 200. Confirm with dashboard metrics.
- **Reversal Signals**: Dashboard shows “Bullish” or “Bearish” with a percentage when reversal conditions are met .
2. **Monitoring the Dashboard**:
- Use the dashboard to assess market conditions in real-time.
- Green (bullish), red (bearish), or gray (neutral) colors highlight key metrics.
- Check “Signal Confid” for confidence in buy/sell signals (higher is better, e.g., >60%).
3. **Trading Decisions**:
- Combine signals with your own analysis (e.g., support/resistance, news).
- Use Golden/Death Cross for long-term trend confirmation.
- Avoid trading in high volatility (dashboard: “Volatility: High”) unless experienced
Best Practices
- **Timeframe Selection**:
- Use higher timeframes (e.g., 4H, Daily) for more reliable signals, especially for Golden/Death Cross.
- Lower timeframes (e.g., 5m, 15m) may produce more signals but with higher noise.
- **Confirm Signals**:
- Cross-check buy/sell signals with dashboard metrics (e.g., Trend, MFI, ADX).
- Use Golden/Death Cross as a trend filter rather than a standalone signal.
- **Risk Management**:
- Always use stop-losses and position sizing based on your risk tolerance.
- Avoid trading during high volatility unless part of your strategy.
- **Regular Updates**:
- Monitor TradingView for script updates from the author (KoKalito) to access new features or bug fixes.
Troubleshooting
- **No Signals**:
- Ensure the chart timeframe matches your settings (e.g., 60m for MTF Period).
- Check if filters (Volume, ADX) are too strict; try disabling them.
- **Dashboard Missing**:
- Verify “Dashboard Position” is set to Left or Right.
- Ensure dashboard metrics are enabled (e.g., Show Comp Score).
- **Alerts Not Triggering**:
- Confirm the alert condition is set to “NeuroFlow Pro Indicator” and the correct option (e.g., “Golden Cross Alert”).
- Check TradingView’s “Alerts” panel for errors or expired alerts.
- Reapply the indicator to the chart if it was recently updated.
- **EMA Crosses Not Showing**:
- Zoom in on the chart to see 🚀 (Golden Cross) or 💀 (Death Cross) symbols.
- Ensure EMA 50 and EMA 200 lengths are not identical (defaults: 50, 200).
Support
- **Author**: KoKalito (check TradingView profile for updates or contact info).
- **TradingView Community**: Post questions in the TradingView Pine Script community or forums.
- **Documentation**: Refer to TradingView’s Pine Script v5 documentation for advanced customization.
- **Risk Warning**: Trading involves risk. Use the indicator as a tool, not a guarantee of profits. Always conduct your own analysis and manage risk appropriately.
Happy trading with **NeuroFlow Pro Indicator**! 🚀

Ultimate CoinTadpoleTrader Indicator Altcoins (UCTA)2.0Overview
UCTA (Ultimate CoinTadpoleTrader Indicator for Altcoins) is designed to help traders identify key turning points in volatile altcoin markets. It applies RSI momentum analysis, along with references to Stochastic RSI’s overbought/oversold zones and MACD expansion behavior to filter out low-probability signals. The script looks for repeated RSI dips below certain thresholds and subsequent recoveries, among other internal checks, to provide clear Buy/Sell icons on the chart.
1. Core Concepts
Multi-Stage RSI & Oscillator References
UCTA primarily relies on standard RSI thresholds (e.g., ≤30 or ≥70) but also references Stochastic RSI for deeper confirmation in potential overextended markets.
When the script detects repeated dives into oversold territory or significant momentum shifts, it generates stronger signals.
MACD Expansion Consideration
Internally, the script checks for moments when MACD lines diverge or “expand” notably, indicating an accelerating move.
If RSI conditions and MACD expansions align, the likelihood of a valid reversal or continuation signal increases.
Multi-Trigger Approach
The indicator may require multiple oversold or overbought triggers within a certain bar count to issue a final Buy or Sell signal.
For instance, RSI might dip into oversold, recover, and dip again. Such repeated patterns are used internally to reduce false positives.
Adaptive Filtering for Altcoins
Altcoins can have sharper, more frequent spikes than BTC.
UCTA’s logic attempts to handle these abrupt moves by fine-tuning the thresholds and waiting periods based on repeated triggers, rather than single crosses.
2. Usage Recommendations
Markets & Timeframes
While originally optimized for altcoins on 1H–4H charts, traders can experiment with different timeframes depending on each coin’s volatility.
If the market is extremely choppy, consider referencing higher timeframes to reduce whipsaws.
Signal Interpretation
Buy Signal → The script detects a probable bottoming pattern when RSI and other oscillator conditions reenter oversold territory multiple times within a short window.
Sell Signal → Identifies points where markets may be hitting a peak, considering repeated or extreme overbought metrics.
Complementary Analysis
Use additional technical or fundamental analysis tools to confirm signals.
UCTA is not intended as a standalone guarantee; rapid price swings can invalidate any single indicator.
3. Disclaimers
Closed-Source Code
The logic behind UCTA is proprietary and not publicly visible.
It comprises advanced filtering methods that rely on recognized indicators (RSI, Stoch RSI, MACD) in a unique combination.
No Performance Guarantees
Cryptocurrency trading is highly speculative. Historical signals do not ensure future results.
Users should apply prudent risk management and never trade solely based on one tool.
Non-Repainting Logic
Signals are determined once a bar closes, so they do not repaint retroactively.
Intrabar fluctuations can cause potential signals to appear or disappear until confirmed at candle close.

Hippo Battlefield - Bulls VS Bears 20 bars## Hippo Battlefield – Bulls VS Bears (20 Bars)
**What it is**
A multi-dimensional momentum-and-sentiment oscillator that combines classic Bull/Bear Power with ATR- or peak-normalization, then layers on RSI and MACD-derived metrics into:
1. **A colored bar series** showing net Bull+Bear Power strength over the last 20 bars,
2. **A dynamic table** of each of those 20 BBP values (grouped into four 5-bar “quartals”), with symbols, per-bar change, and rolling averages, and
3. **A composite “Weighted BBP” histogram** blending normalized RSI, MACD, and BBP into a single view.
---
### Key Inputs
- **Length (EMA)** – look-back for the underlying EMA (default 60)
- **Normalization Length** – look-back window for peak-normalization (default 60)
- **Use ATR for Norm.** – toggle ATR-based normalization vs. highest-abs(BBP)
- **Show Tables** – toggle the bottom-right 21×11 grid of raw and average BBP values
---
### What You See
#### 1. Colored Bars (Overlay = false)
- Bars are colored by normalized BBP intensity:
- Extreme Bull (≥+10): deep blue
- Strong Bull (+5 to +10): green/yellow
- Weak Bull (+0 to +5): dark green
- Weak Bear (–0 to –5): dark red
- Strong Bear (–5 to –10): pink/red
- Extreme Bear (<–10): magenta
#### 2. Bottom-Right Table (20 Bars of Data)
- Divided into four columns (0–4, 5–9, 10–14, 15–19 bars ago) and one “average” row.
- Each cell shows:
1. Bar index (1–20),
2. Normalized BBP value (to four decimals),
3. Direction symbol (↑/↓/=),
4. Bar-to-bar change (± value),
5. A separator “|”.
- At the very bottom, each column’s 5-bar average is displayed as “Avg: X.XXXX” with a dot marker.
#### 3. Top-Center Mini-Table
- When ≥20 bars have elapsed, shows the date at 20 bars ago and the average BBP across the full 20-bar window.
#### 4. Normalized RSI Line
- Rescales the classic 14-period RSI into a –20…+20 band to align with BBP.
#### 5. MACD Lines (Hidden) & Composite Histogram
- MACD and signal lines are calculated but not plotted by default.
- A “Weighted BBP” histogram combines:
- 20% normalized RSI,
- 20% average of (MACD + signal + normalized BBP),
- 60% normalized BBP
- Plotted as columns, color-coded by strength using the same palette as the main bars.
#### 6. Middle Reference Line
- A horizontal zero line to anchor over/under-zero readings.
---
### How to Use It
- **Trend confirmation**: Strong blue/green bars alongside a rising histogram suggest bull conviction; strong reds/magentas signal bear dominance.
- **Divergence spotting**: Watch for price making new highs/lows while BBP or the histogram fails to follow.
- **Quartal analysis**: The 5-bar group averages can reveal whether recent momentum is accelerating or waning.
- **Cross-indicator weighting**: Because RSI, MACD, and raw BBP all feed into the final histogram, you get a smoothed, blended view of momentum shifts.
---
**Tip:** Tweak the EMA and normalization length to suit your preferred timeframe (e.g. shorter for intraday scalps, longer for swing trades). Enable/disable the table if you prefer a cleaner pane.

GZ Indicator✍️ Description:
GZ Indicator is an advanced indicator that automatically detects Golden Zones, optimal market entry zones based on the latest significant pivots. The system uses Fibonacci extensions to project precise price targets, while providing a dynamic, visual stop-loss.
Main features:
- Pivot Detection: Automatic identification of significant pivots (high/low).
- Optimal Entry Zones (OTE): Automatically calculates ideal entry zones based on Fibonacci retracements.
- Precise Targets: Displays price targets with Fibonacci extensions.
- Dynamic Stop-Loss: Visual stop-loss zone adjusted to market conditions.
- RSI and MACD display: Add an RSI and MACD chart to facilitate trend analysis and confirm your entries.
- Intelligent refresh: Automatic deletion of the active zone as soon as the stop-loss is reached.
🔥 Key features:
Automatic detection of significant pivots (highs and lows)
Dynamic calculation of the OTE (Optimal Trade Entry) zone on retracements 0.618 - 0. 705
Clear display of price targets based on extensions
Intelligent updating: old zones are retained for historical analysis
Automatic deletion of current zone if Stop-Loss is reached
Contextual RSI and MACD chart for improved trend analysis
Code optimized for minimum recalculations, fluid even on fast time units.
⚡ How to use it:
Spot the appearance of a Golden Zone.
Enter a position in the zone with RSI/MACD or price action confirmation.
Use the targets displayed to set your progressive Take-Profits.
Respect the Stop-Loss zone automatically drawn.
🛠️ Available parameters:
Activate/deactivate RSI/MACD chart
Choose number of pivots for detection
Display old targets
[⚠️ Disclaimer:
This indicator is a decision-making tool. It is not intended to be used as financial advice. Please always perform your own analysis and manage your risks properly.
🔥 Bon trading ! 🚀

Scalper's Fractal Cloud with RSI + VWAP + MACD (Fixed)Scalper’s Fractal Confluence Dashboard
1. Purpose of the Indicator
This TradingView indicator script provides a high-confluence setup for scalping and day trading. It blends momentum indicators (RSI, MACD), trend bias tools (EMA Cloud, VWAP), and structure (fractal swings, gap zones) to help confirm precise entries and exits.
2. Components of the Indicator
- EMA Cloud (50 & 200 EMA): Trend bias – green means bullish, red means bearish. Avoid longs under red cloud.
- VWAP: Institutional volume anchor. Ideal entries are pullbacks to VWAP in direction of trend.
- Gap Zones: Shows open-air zones (white space) where price can move fast. Used to anticipate momentum moves.
- ZigZag Swings: Marks structural pivots (highs/lows) – useful for stop placement and range anticipation.
- MACD Histogram: Shows bullish or bearish momentum via background color.
- RSI: Overbought (>70) or oversold (<30) warnings. Good for exits or countertrend reversion plays.
- EMA Spread Label: Quick view of momentum strength. Wide spread = strong trend.
3. Scalping Entry Checklist
Before entering a trade, confirm these conditions:
• • Bias: EMA cloud color supports trade direction
• • Price is above/below VWAP (confirming institutional flow)
• • MACD histogram matches direction (green for long, red for short)
• • RSI not at extreme (unless you’re fading trend)
• • If entering gap zone, expect fast move
• • Recent swing high/low nearby for target or stop
4. Risk & Sizing Guidelines
Risk 1–2% of account per trade. Place stop below recent swing low (for longs) or high (for shorts). Use fractional sizing near VWAP or white space zones for scalping reversals.
5. Daily Trade Journal Template
- Date:
- Ticker:
- Setup Type (VWAP pullback, Gap Break, EMA reversion):
- Entry Time:
- Bias (Green/Red Cloud):
- RSI Level / MACD Reading:
- Stop Loss:
- Target:
- Result (P/L):
- What I Did Well:
- What Needs Work:
